
Sam Crossland · 1st May 2025
How to use Salesforce Code Analyzer for better code quality & security
In spring 2024, Salesforce released their official GitHub action on the GitHub marketplace, which made integrating your version control system (VCS) with the Salesforce Code Analyzer (SFCA) tool simple — but what if you're running on a different VCS and still want to leverage the scanner? In this blog post, Sam Crossland, DevOps Architect at Gearset, covers everything from the basics of Static Code Analysis, to understanding the benefits of using Salesforce’s Code Analyzer (SFCA), and how to easily integrate it into your Salesforce DevOps pipeline if your team uses Azure DevOps (ADO).
What is Static Code Analysis and why does it matter for Salesforce?
In any software development process, ensuring code quality is essential — but catching issues before they reach production can be challenging. That’s where Static Code Analysis (SCA) comes in. SCA is a method of checking your source code without actually executing it, allowing teams to identify potential quality issues, errors, and security vulnerabilities early in the DevOps lifecycle. By running a code analyzer scan on your Salesforce code, you can detect issues at various stages of the development lifecycle, helping to prevent bugs and improve the overall health of your codebase.
Static analysis tools use features like custom rules and rulesets that enable teams to set their own standards for acceptable code quality. Teams can adjust settings like severity thresholds (where a range is used instead of boolean “good” or "bad”violations), choose which selected files to scan, and determine how scans run during different points in the development cycle. Whether you only scan selected files or an entire managed package, these SCA tools produce lists of potential problems, enabling teams to act before issues reach production.
For Salesforce development, where multiple languages and metadata types are involved, implementing both full and delta scans of your Salesforce code is crucial. Regular scans not only identify existing technical debt but they also help establish consistent coding standards across your team. By integrating SCA into your DevSecOps strategy, you ensure that code and security reviews become a natural part of your CI/CD pipeline, strengthening your overall DevOps process.
What are the benefits of SCA for Salesforce teams?
As we’ve already touched on, using SCA tools in your Salesforce development lifecycle provides a range of benefits that enable you to:
- Detect bugs, errors, and vulnerabilities early — before they reach production
- Improve code consistency by enforcing team-wide code standards
- Improve code quality by proactively identifying quality issues
- Improve and pass security reviews by integrating DevSecOps best practices
- Meet regulatory compliance requirements with custom rules
- Reduce technical debt by addressing historic and future code issues
- Pass the AppExchange Security Review Wizard and get managed packages approved for listing on the Salesforce AppExchange
With tools like code explorers and code editors, especially those offering a command palette, developers can seamlessly integrate SCA into their daily workflows — easily initiating scans of selected files or entire repositories. By ensuring that every code submission meets your configured standards, you improve team collaboration, deliver higher-quality features, and enhance your Salesforce code’s long-term maintainability.
What is Salesforce Code Analyzer and why use it?
Salesforce Code Analyzer (SFCA) was originally released in 2020 as ‘Salesforce CLI Scanner’. It’s been developed over the years as an open source code quality scanner for various programming languages used across the Salesforce ecosystem, rebranding when v3.x was released in 2022. One of the main directives of the unified tool is to write better, performant, secure code, ensuring teams “shift left” in their development cycle to find code quality issues earlier and tackle them quickly.
SFCA’s architecture uses various “engines” that focus on key programming languages and concepts relevant to Salesforce development. These engines check for quality and security issues, then bring the results together in an easy-to-read format, like a CSV file or HTML report. Examples of the engines include PMD for scanning Apex code, ESLint/RetireJS for analyzing javascript (such as LWCs or custom scripts), and Salesforce Graph Engine for performing a deeper investigation into code structure via data flow analysis and to find potential security vulnerabilities.
Version 5 of SFCA is in Beta and offers key improvements for Salesforce teams, including:
- Two new engines for analyzing Regex and Flows
- A new configuration YAML file for easier global customization of SFCA
- Greater flexibility in selecting specific rules from individual engines, including a fork of AppExchange 2GP rules
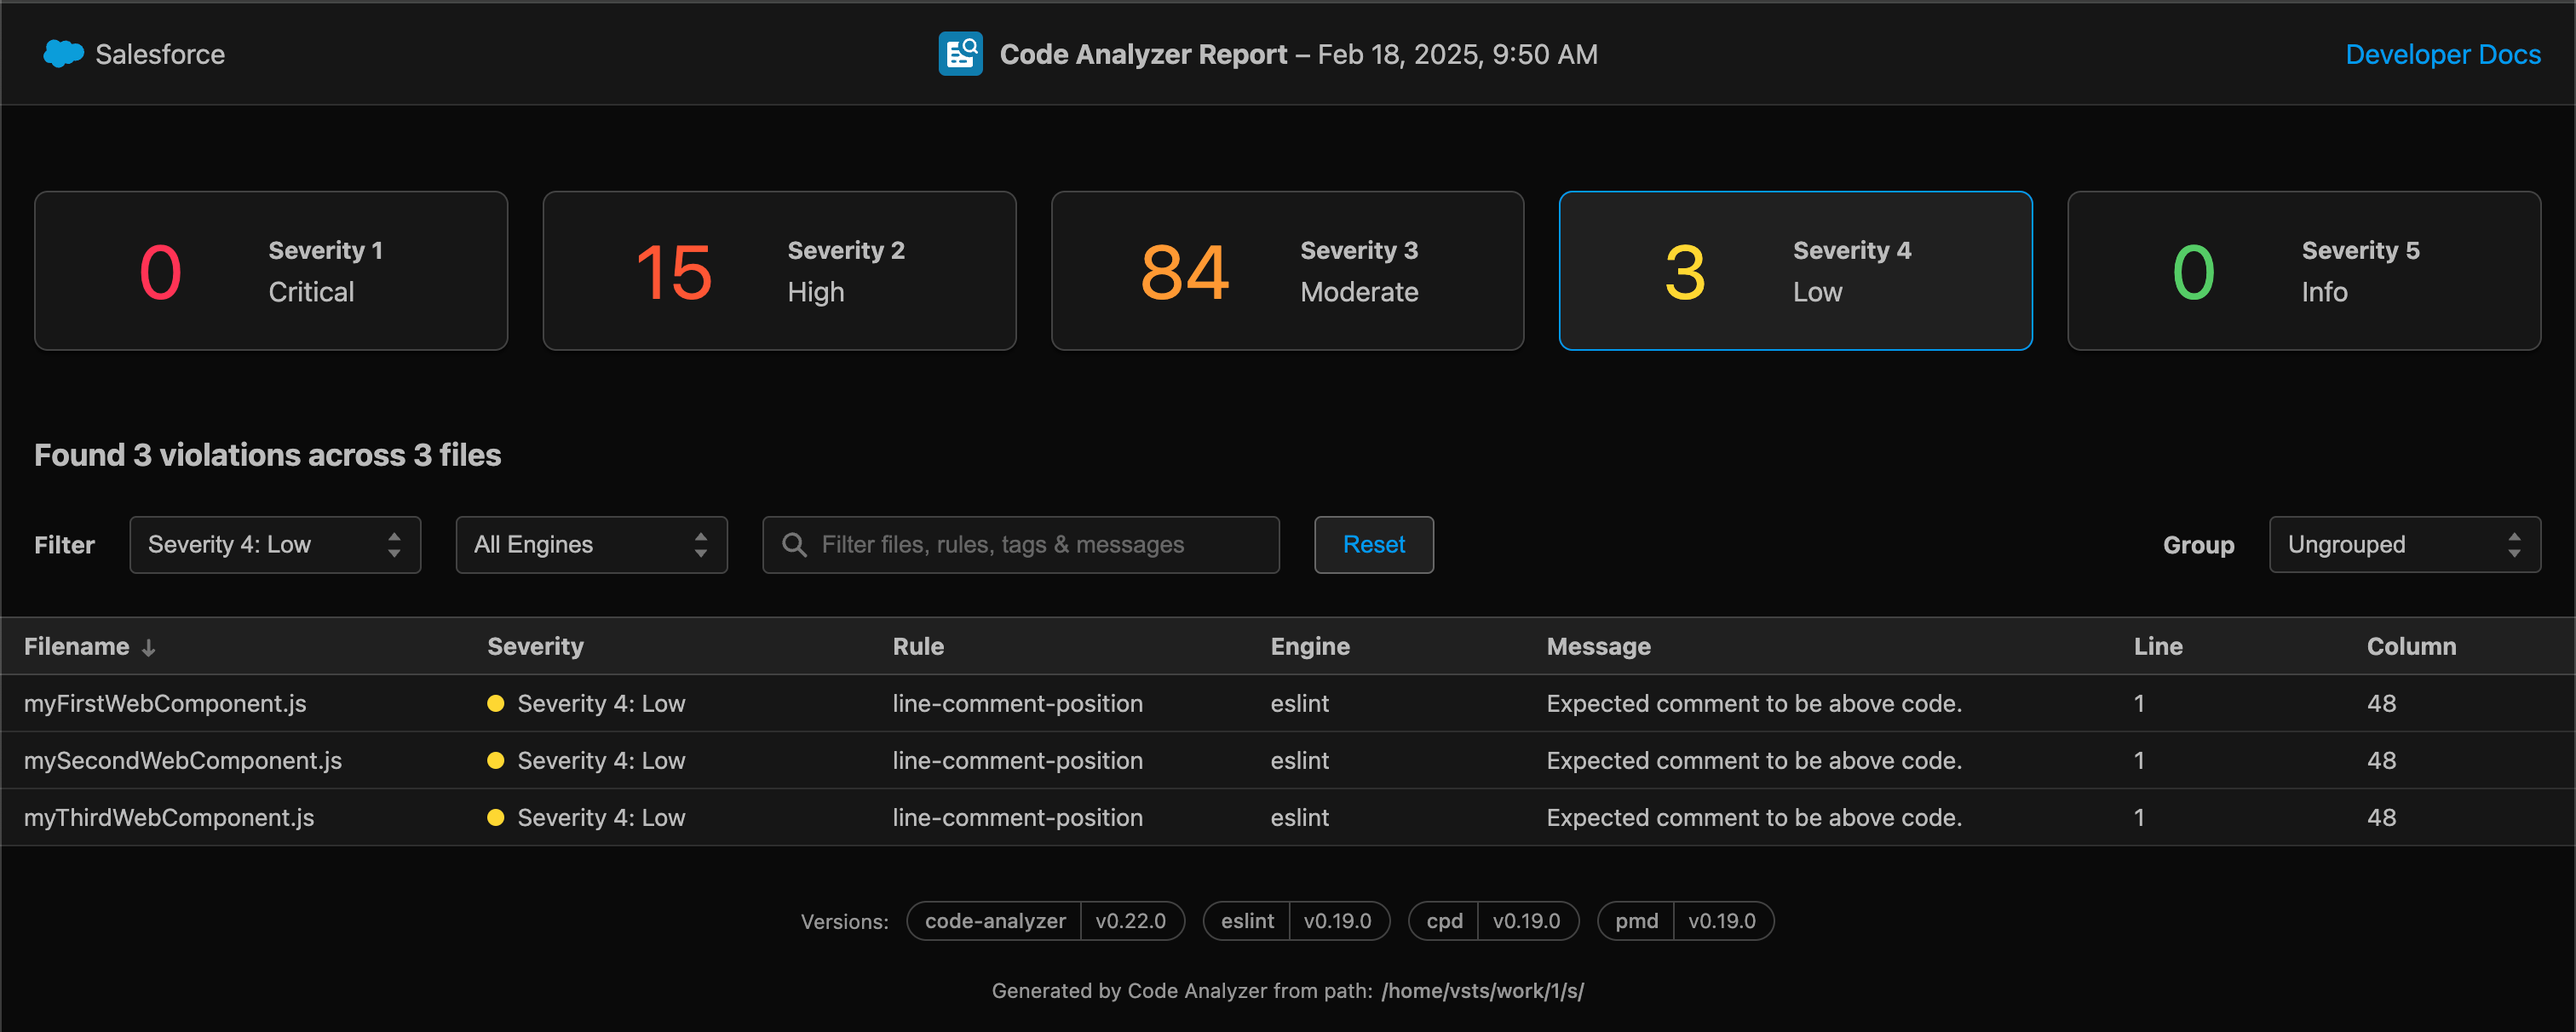
- Significantly improved HTML reports with enhanced filtering and grouping options
There is also another set of changes to be aware of with the Version 5 release of SFCA. Salesforce teams will need to update how they use command-line arguments (CLI) and selections, and ensure additional packages, like Python, are installed for smooth integration with your CI/CD pipeline. There is a useful v4 > v5 guide here that helps outline command changes and how to transition custom configurations.
Using SFCA with Azure DevOps: what you need to know
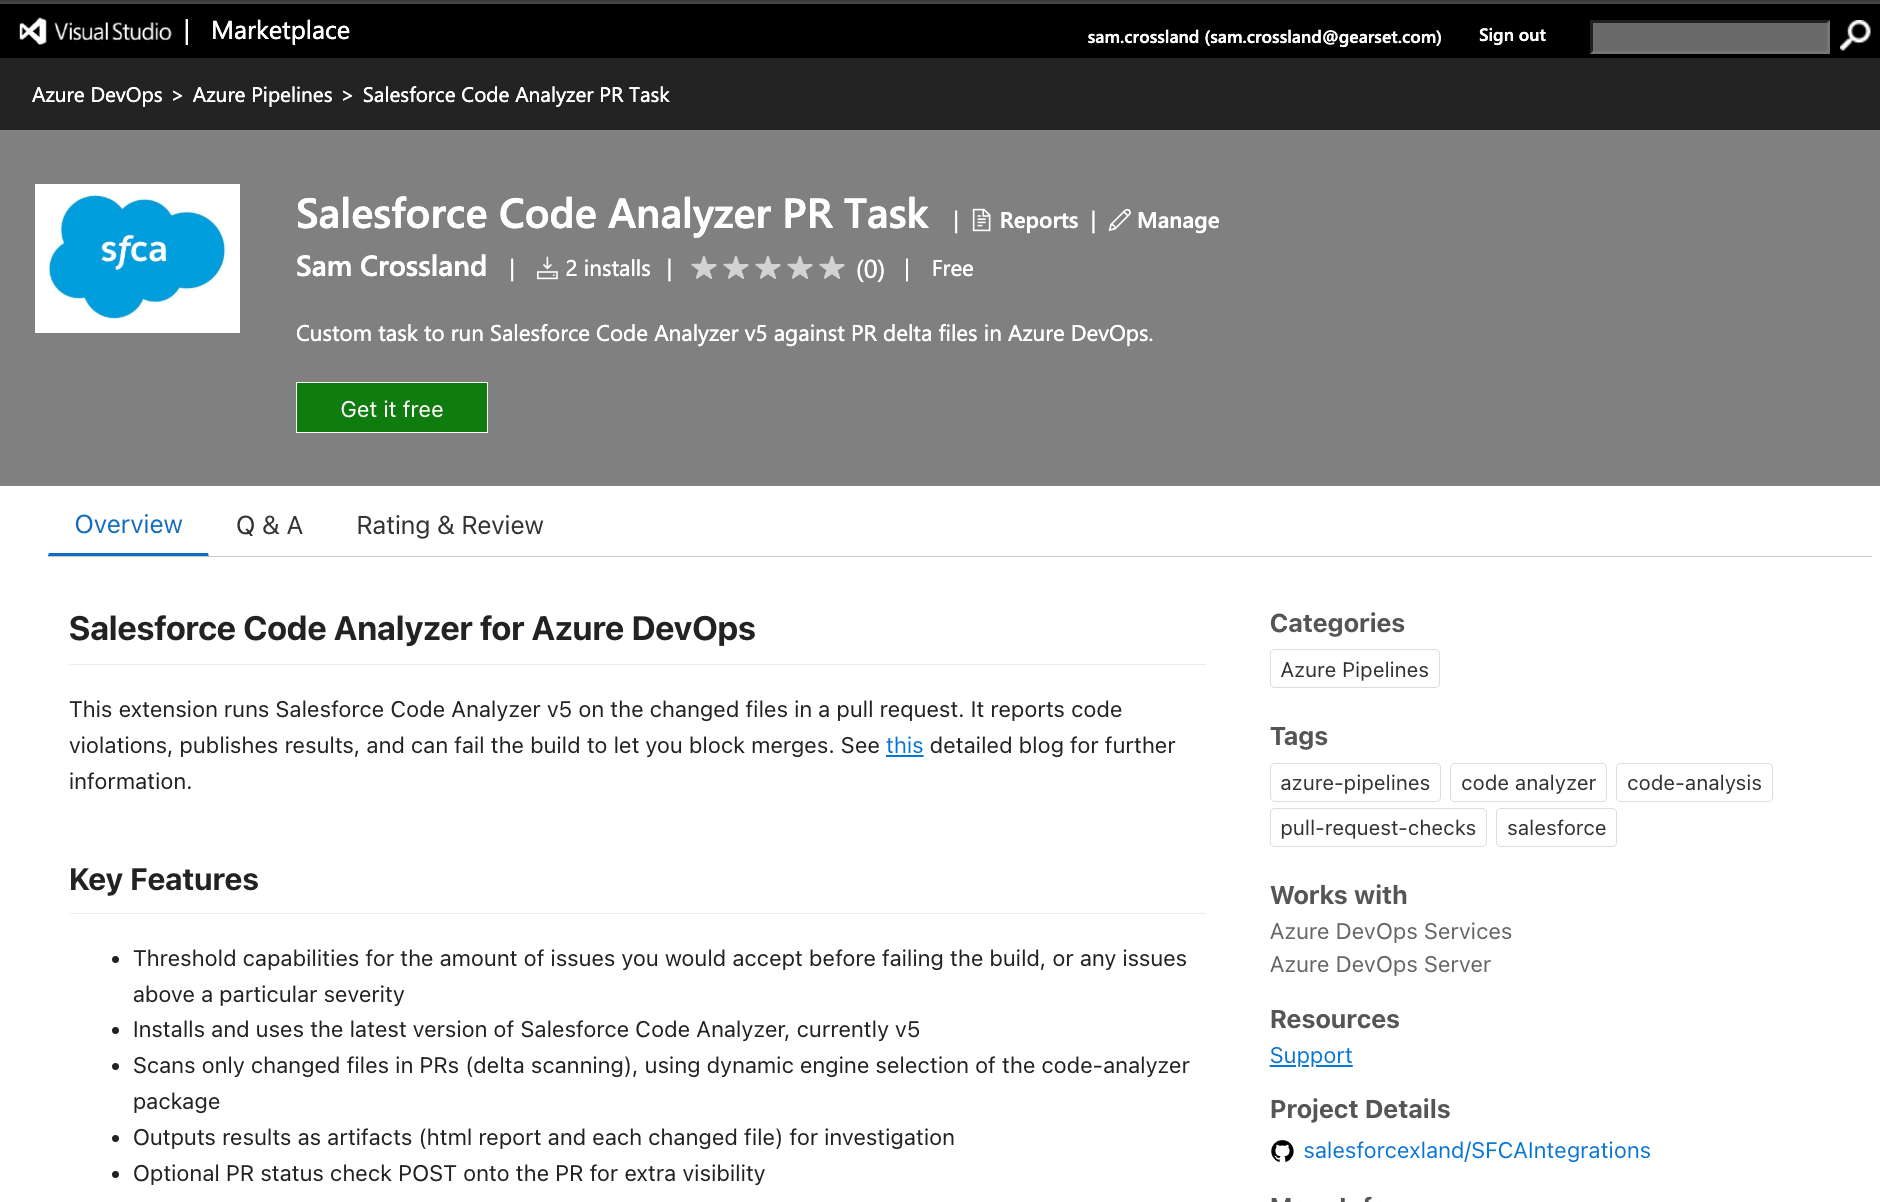
Now that we’ve covered what SFCA is, let’s look at how to integrate it with Azure DevOps (ADO). As a DevOps Architect, I wanted to drive forward the available integrations in this area, and have created a publicly available ADO marketplace extension here. This makes it easier to get SFCA up and running by using a custom task, as well as different parameters you can configure. This configuration will tell ADO when to run Code Analyzer (like triggering on a pull request (PR) to a specific branch, or on a schedule) and where to output the results for review. These results will help you assess whether your code meets the necessary quality and security thresholds before you merge your PR, or give a holistic view of your codebase.
Some of the key characteristics and benefits of this extension are:
- A packaged, versioned and easily installable set of logic to get SFCA running in your repository, without having to code and develop a custom pipeline.
- This includes using an ADO repository or a GitHub repository, tying into ADO Pipelines as the orchestrator, although if you are using GitHub there’s also the Salesforce-provided action here which allows similar functionality.
- Detailed logs and artefacts to analyse after the scan has completed on a PR (which only runs fully if valid file extensions are found).
- The custom task that comes with the extension has several parameters to give you control over the configuration, including the ability to run across a full branch and/or PRs, total violation failures vs using severity thresholds, and the ability to POST detailed status checks and comments back onto the PR for wider information.
- You can also use the code-analyzer.yml configuration file to customize the scan, and even pass in specific engines to scan with instead of the default “Recommended” if required.
- Rather than having to handle some of the ADO nuances via the UI, things like shallow fetch and unnecessary pipeline triggers are handled in code.
There are several important steps to follow — plus a few nuances in ADO that differ from other version control providers. Before we get started, make sure you have the appropriate permissions to make changes across your repository and set up pipelines.
In this section, we’ll walk you through:
- Key prerequisites for setting up the integration, such as agents and permissions.
- Some partnering instructions to the ADO Marketplace extension, and an explanation of why and how to use these key parameters.
- Important considerations to keep in mind when working with ADO.
With Version 5 now having completely replaced Version 4, this blog post focuses on the latest version of SFCA, and the great benefits it brings. So let’s dive into the setup process to get SFCA working seamlessly in your ADO environment.
Initial setup
Code coverage check
This step is optional depending on your configuration, but it will help prevent never-completing status checks from appearing on pull requests (PRs) that monitor PR checks.
We need to turn off a feature that can cause never-completing status checks to appear against PRs in Gearset or other tools watching the PR for checks.
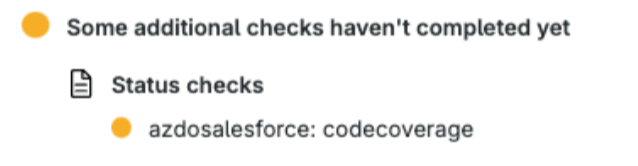
Azure DevOps (ADO) includes a Code Coverage feature for certain programming languages (like .NET), which provides detailed scan reports during builds. This feature is enabled by default across your repository. When it encounters unsupported code (such as Salesforce metadata), it may briefly create a status check on PRs that disappears afterward but remains visible as an incomplete check.
To stop these unnecessary checks from appearing:
- Add a YAML configuration file to disable code coverage triggers.
- Place the file in the root of your repository (at the same level as sfdx-project.json or README.md).
- Ensure the YAML file is present on:
- The main/master branch (essential for consistent behavior)
- Any long-standing branches to prevent PR-related issues
Follow the detailed steps here to disable these checks from running unnecessarily, as well as this example YAML file provided here. Remember, this will disable code coverage across the board for the repo, so assess any other ADO pipelines that may be affected before changing these settings.
Get SFCA running in ADO
Configuring the ADO Pipeline
Now let's talk about the steps you need to take to activate SFCA scanning in ADO.
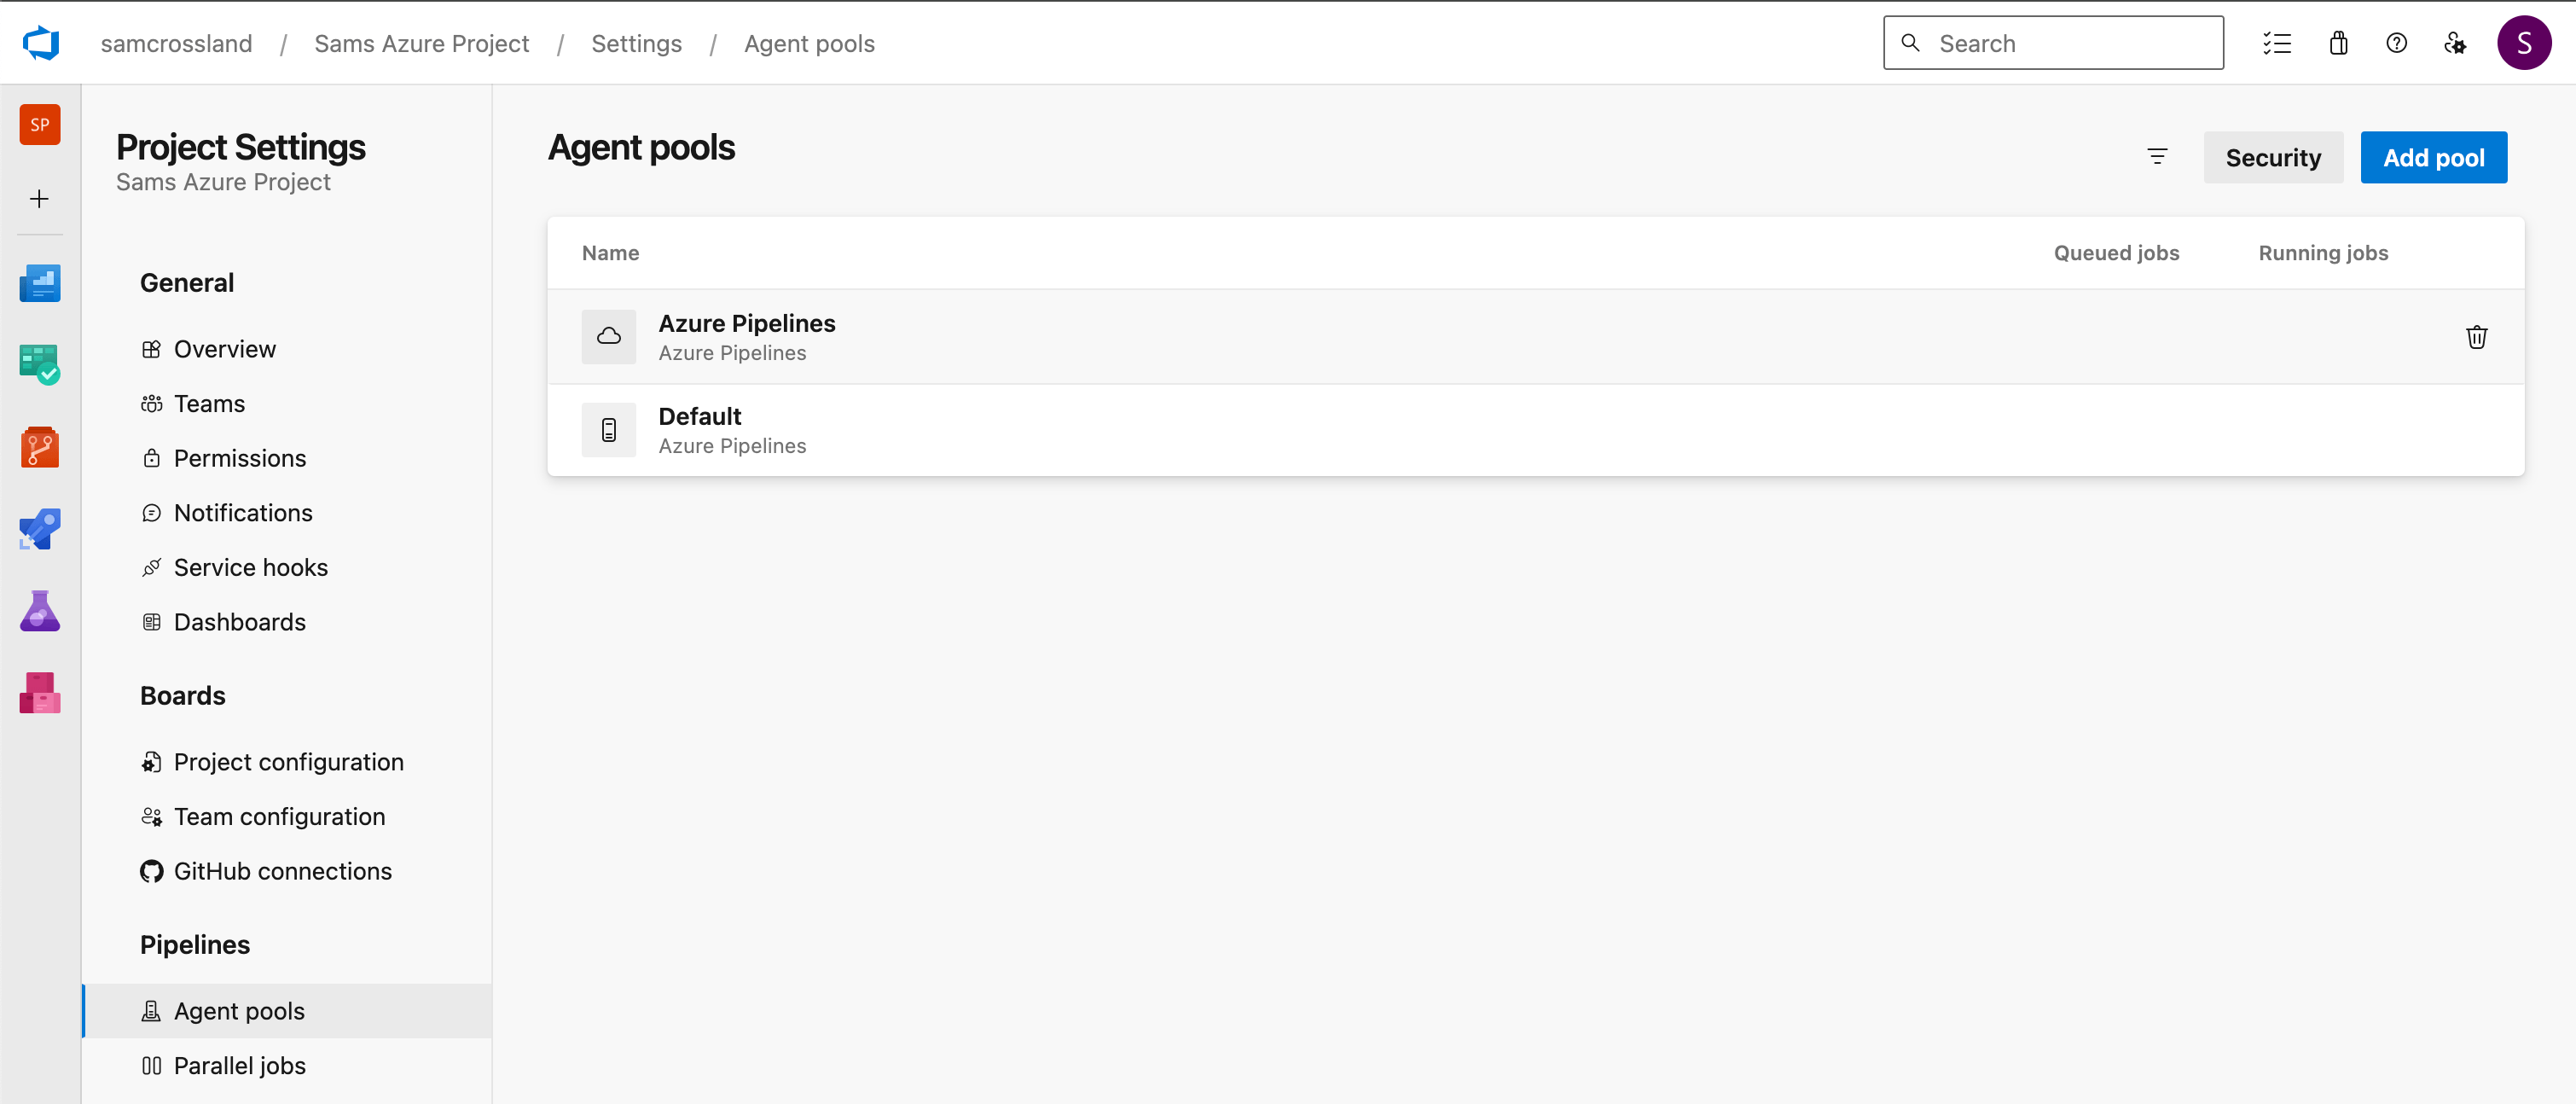
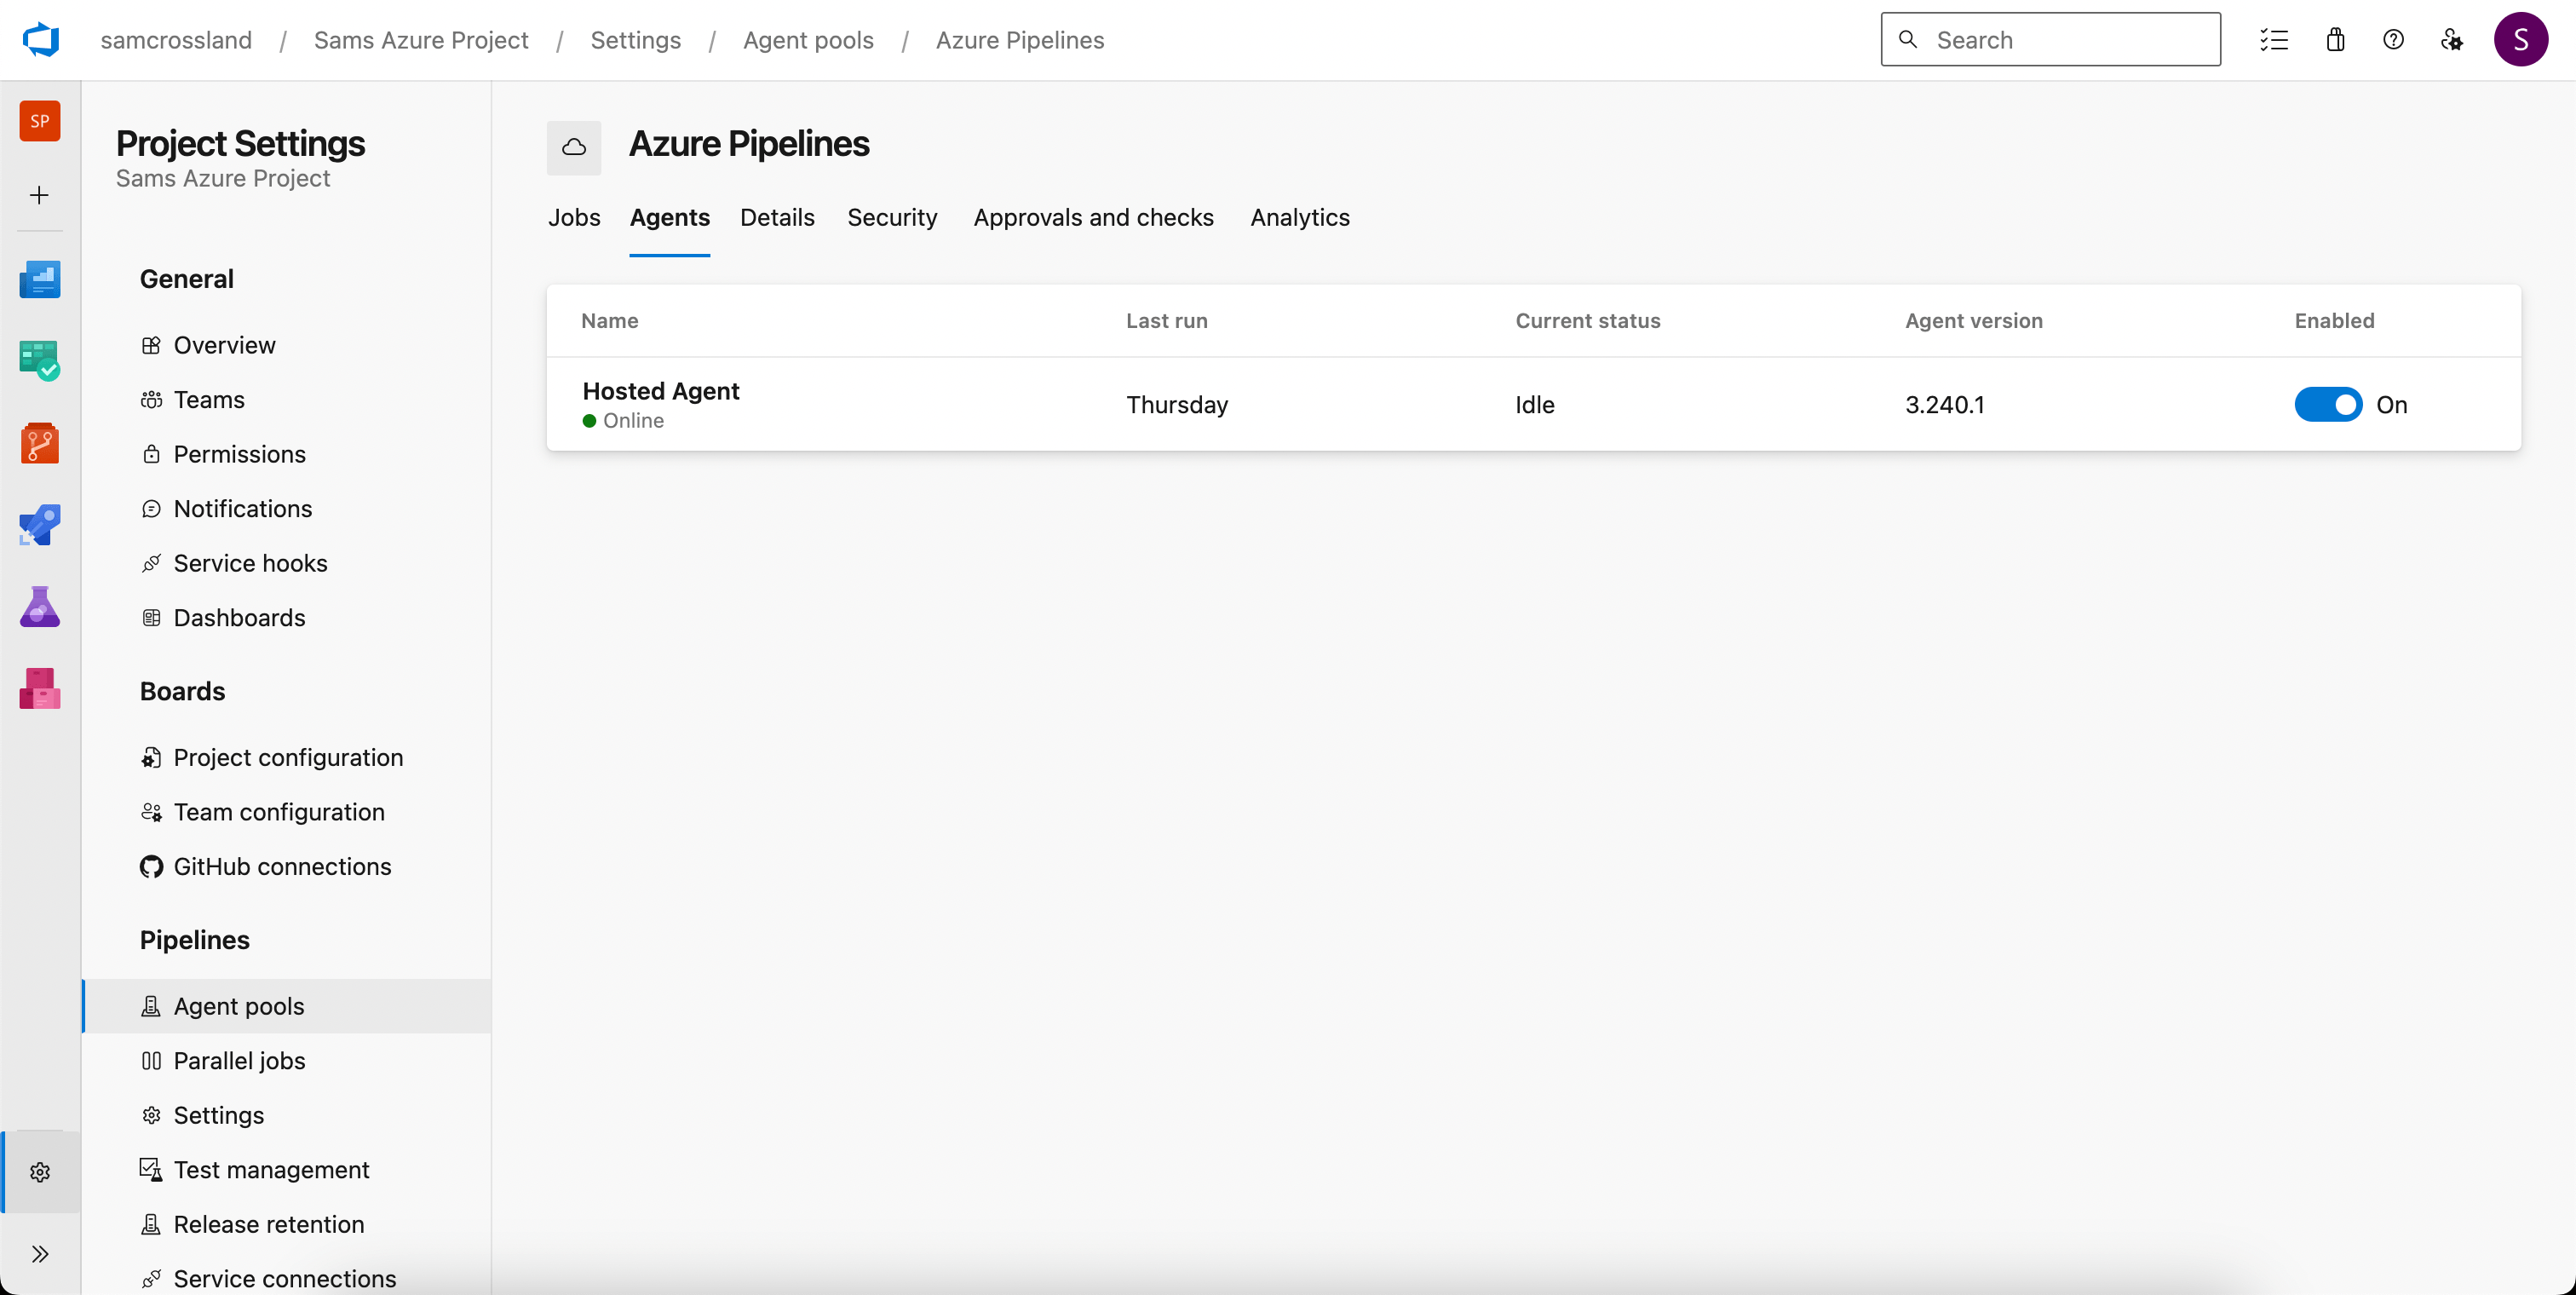
Step 1: Agents
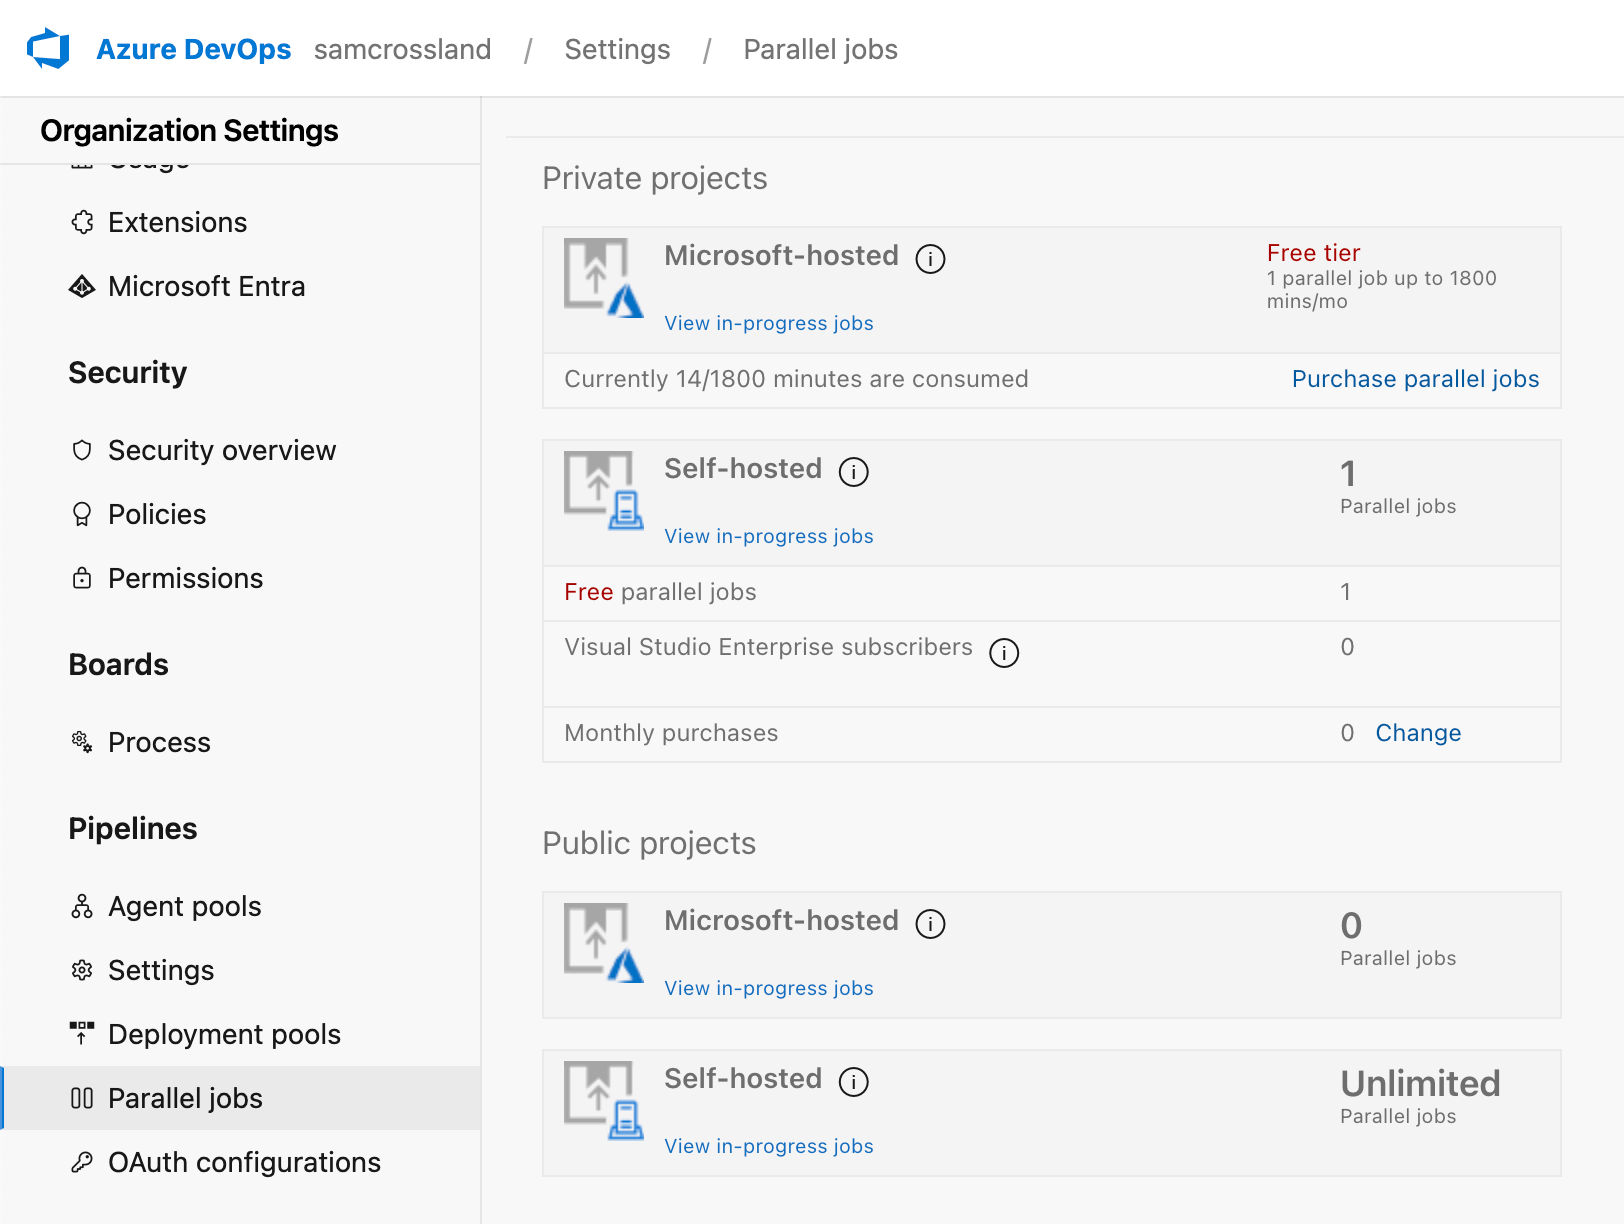
Ensure you have available Agents to conduct the scanning, either in the Cloud or self-hosted. You can verify this in Project Settings > Agent Pools to see if any rows appear in the Agents tab. You’ll need to have at least one agent flagged as “online” for the pipeline to run.
If you don't have dedicated or paid Agents configured, you may receive this error message as you get further along the setup process:
“No hosted parallelism has been purchased or granted.”
This is likely due to a change that Microsoft made in disabling free grants of runners, as explained here. You’d need to submit a request and wait for the runner to become available (could be up to 2-3 business days) before continuing setting up SFCA for ADO. This will only give you one runner so consider any parallel needs here if you need more.
You’ll also need to ensure that, at an organization level, you have an actual “tier” available for Microsoft-hosted runners, or a self-hosted runner available before continuing.
Step 2: Install the ADO marketplace extension
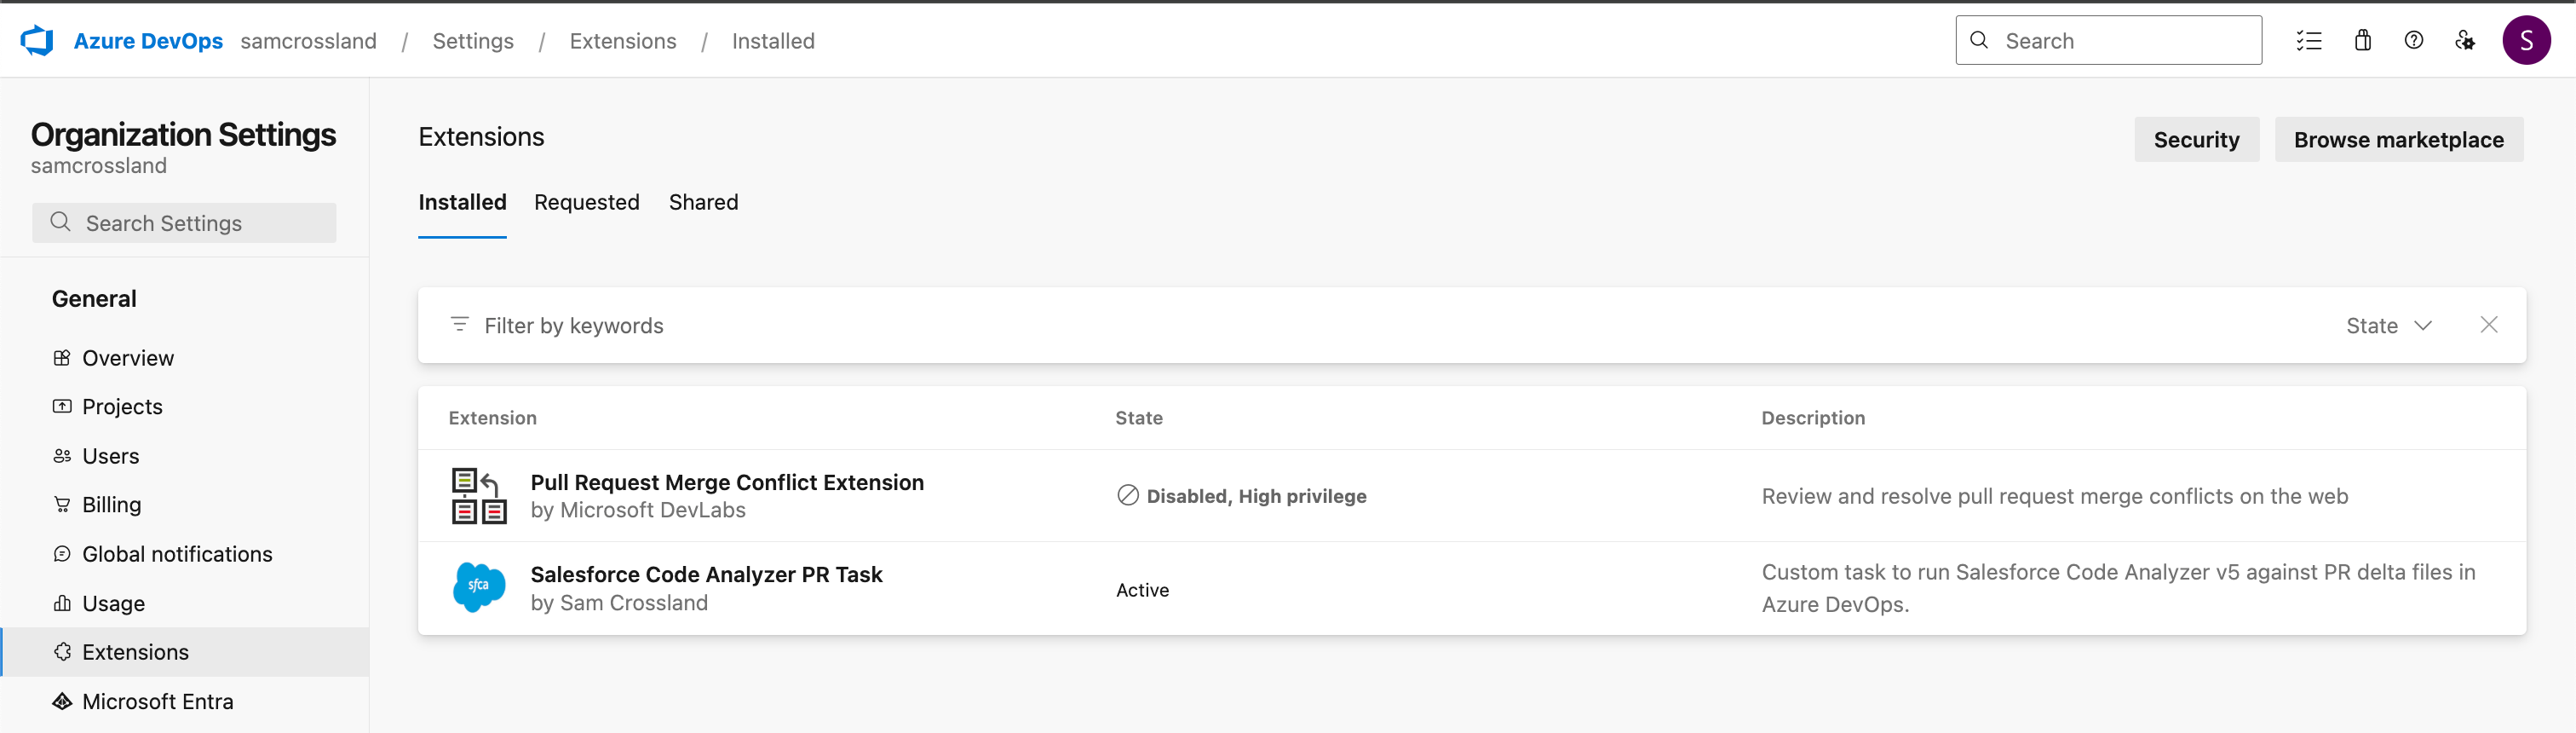
Before we go ahead and create the pipeline, we now need to find and install the marketplace extension into your org and verify that it’s ready for use.
- Head to the extension here.
- Review it for your needs, and then install into your org.
- Verify it’s available and installed into your org by heading to Organization Settings > Extensions > Installed. This is where you’d come to verify versions or manage the extension in future.
- In the next step (pipeline creation), we should then see a custom task show up, which we can leverage the parameters of and use in our overall workflow.
Step 3: Setup a new pipeline
Create a new pipeline in ADO by heading to your project. Select Pipelines > New Pipelines and link into your Salesforce repository (Azure Repos Git).
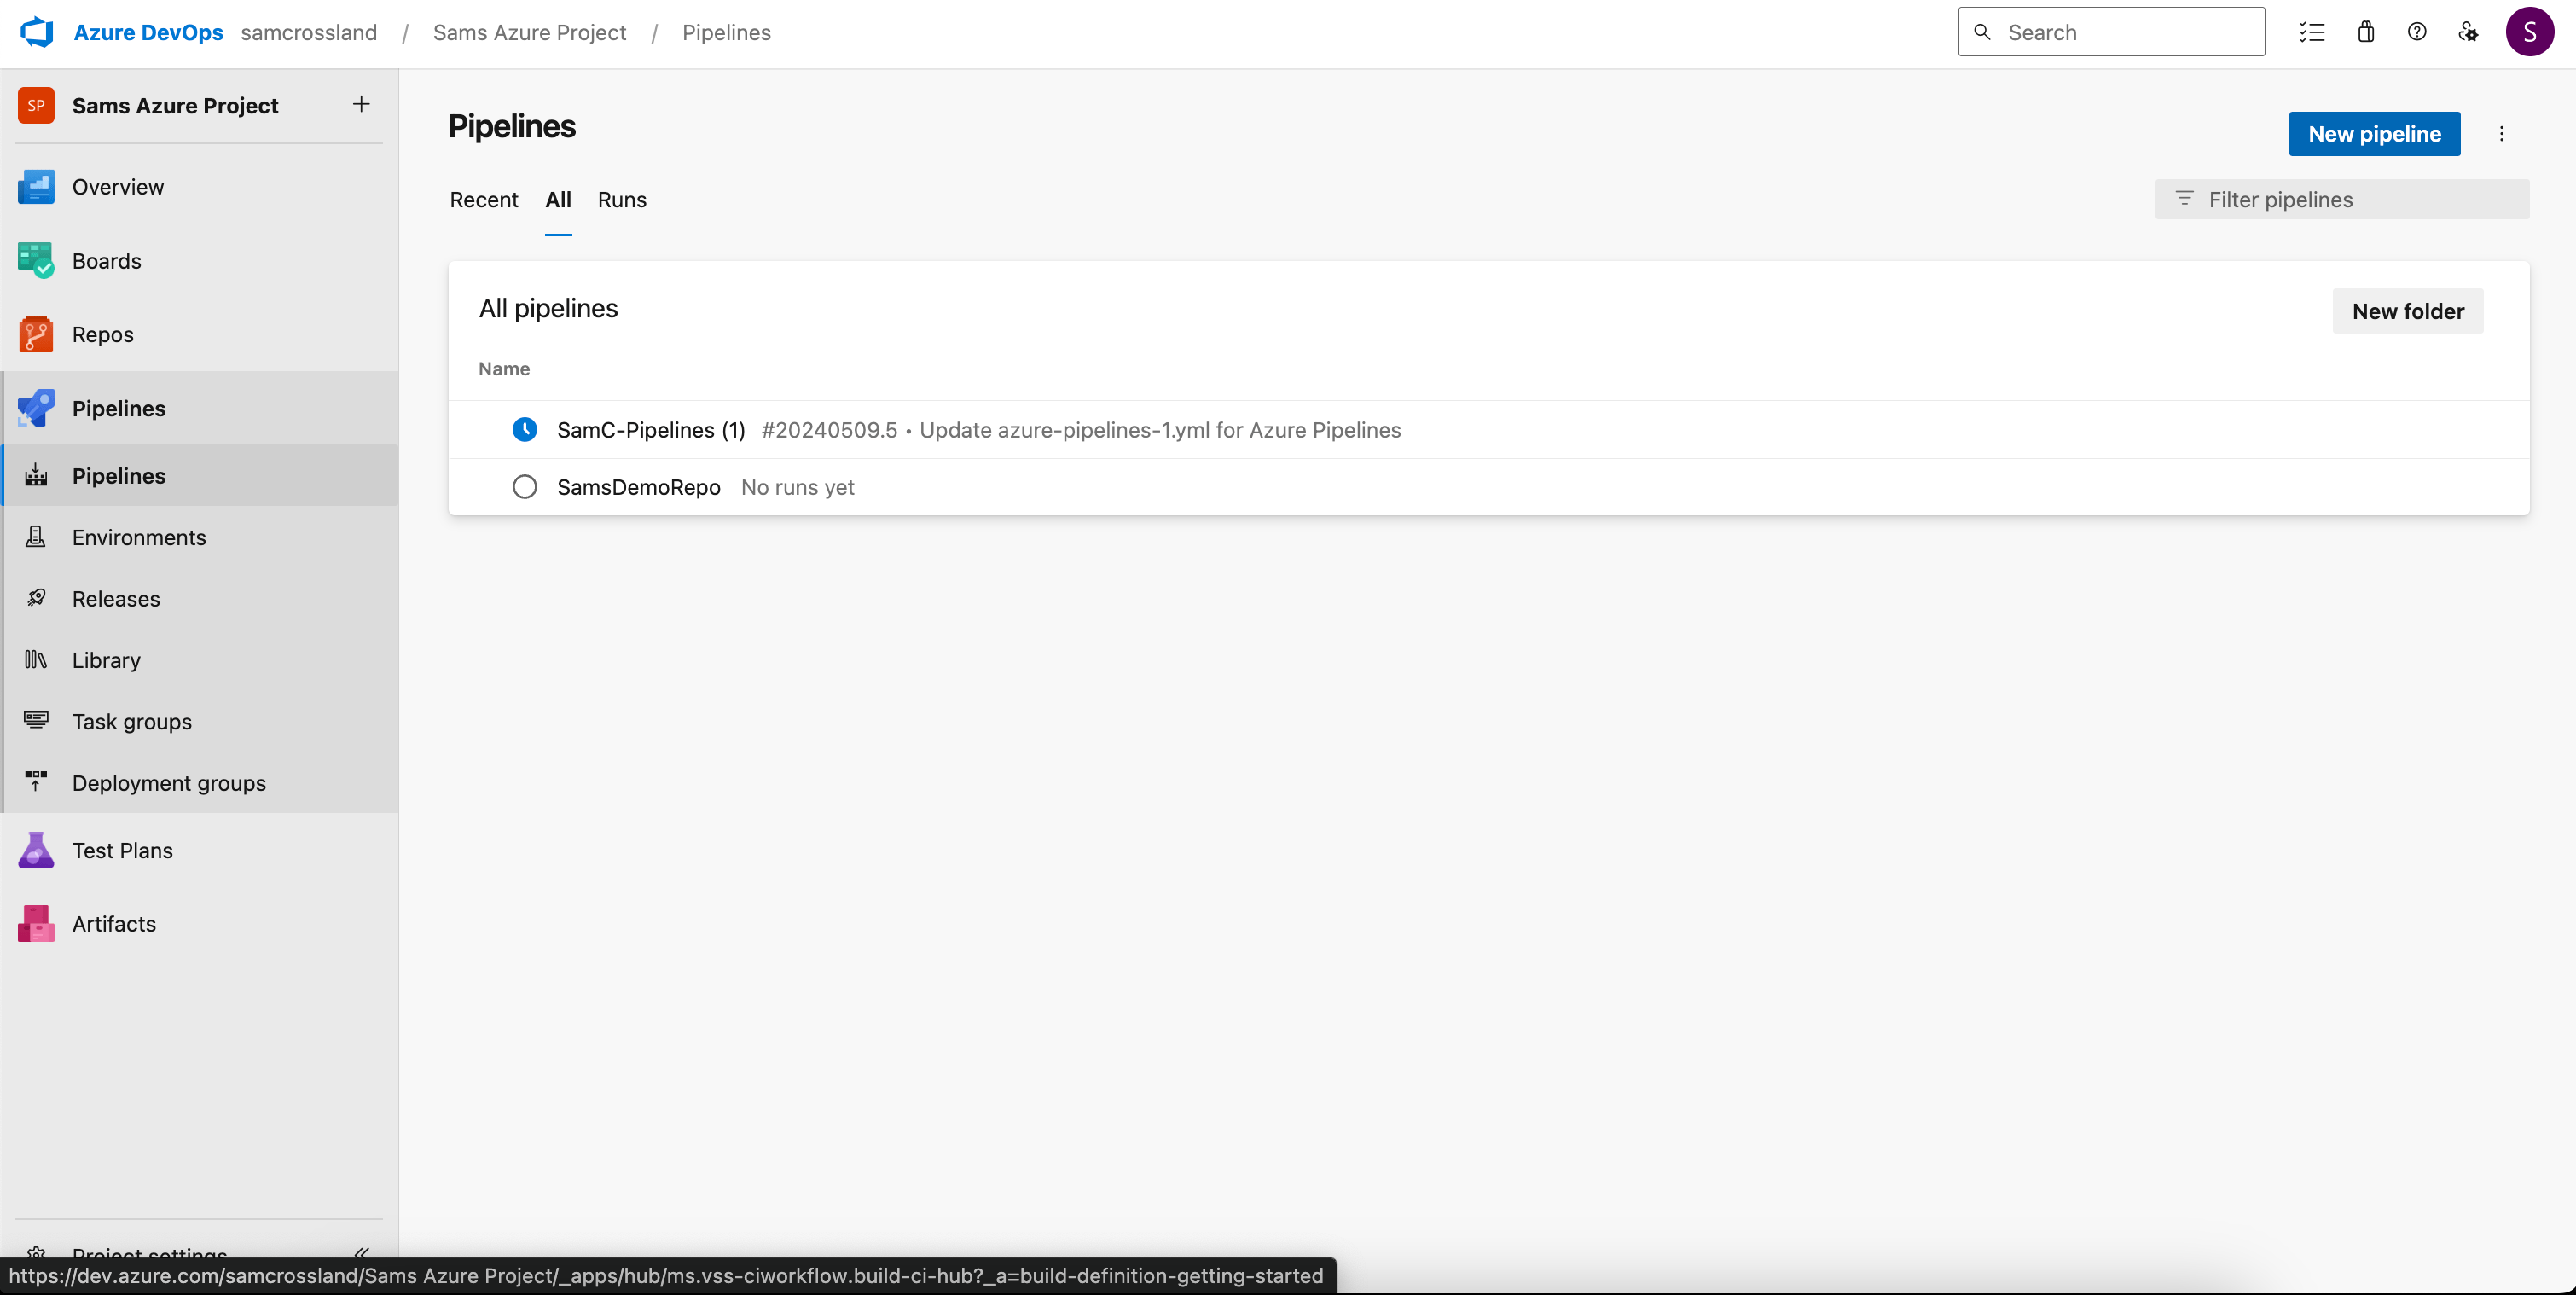
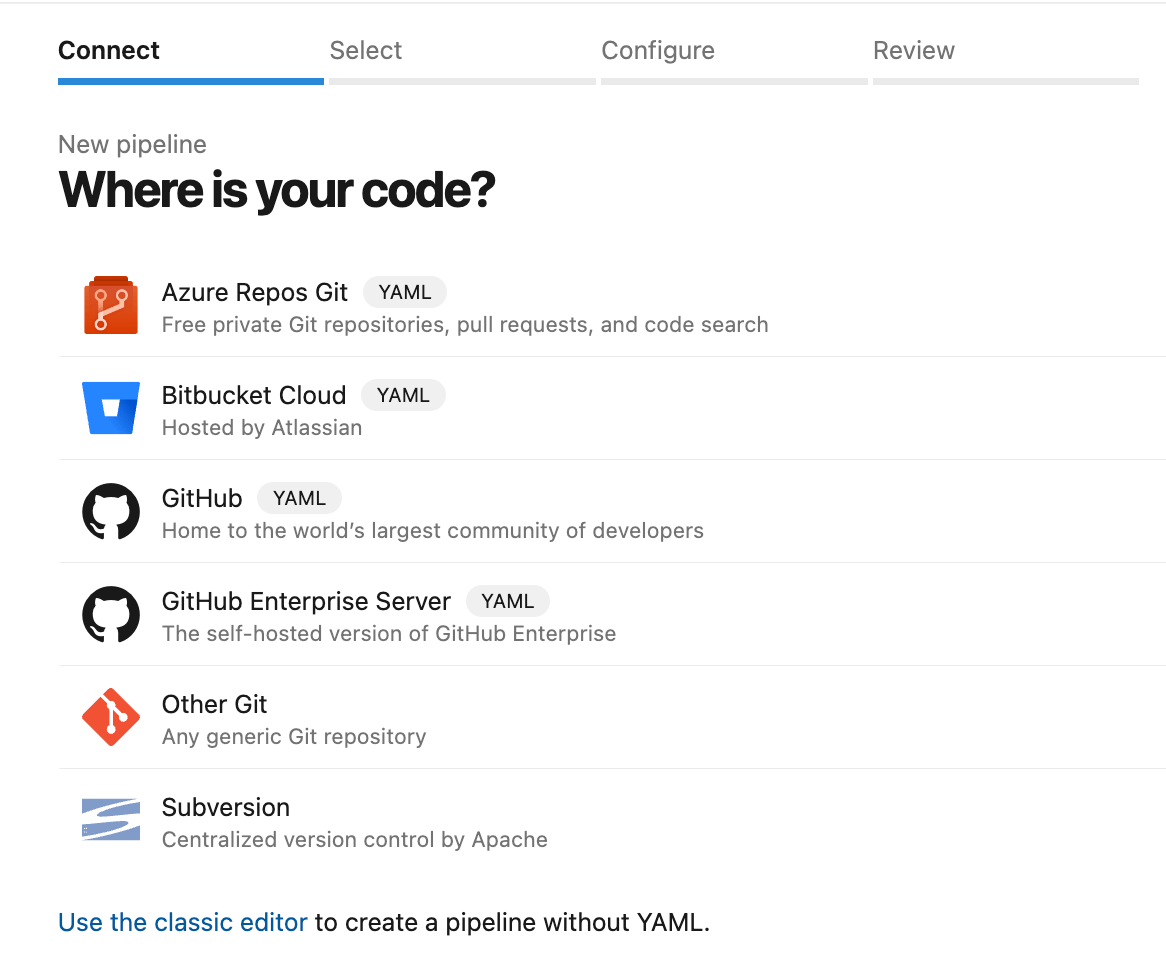
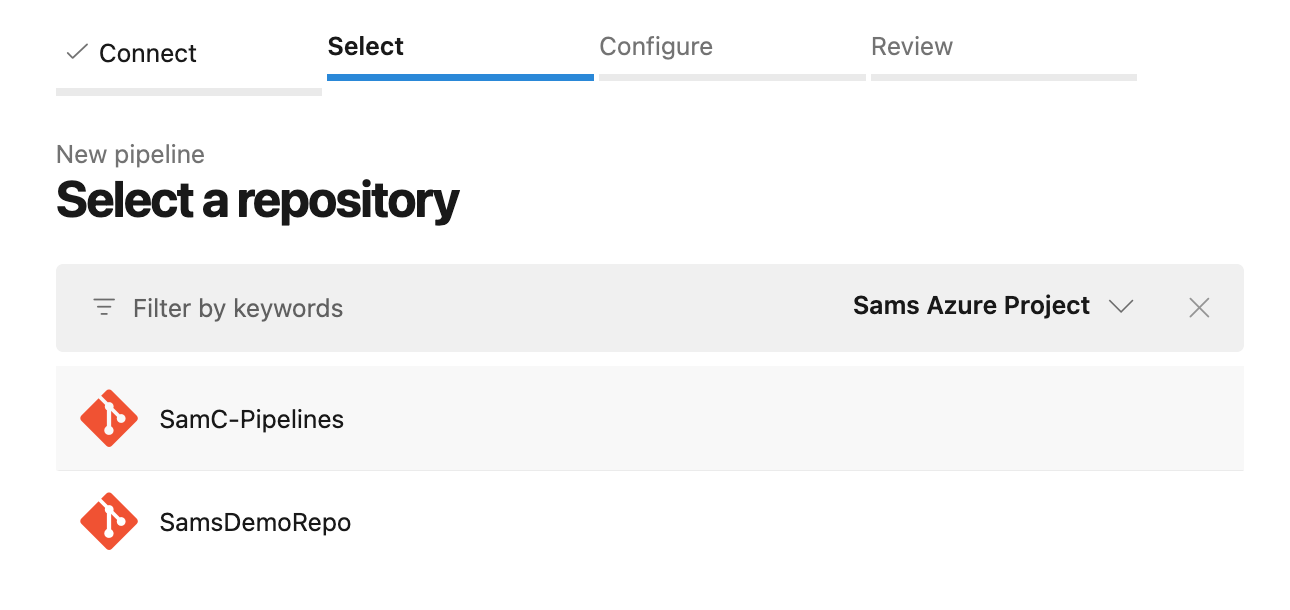
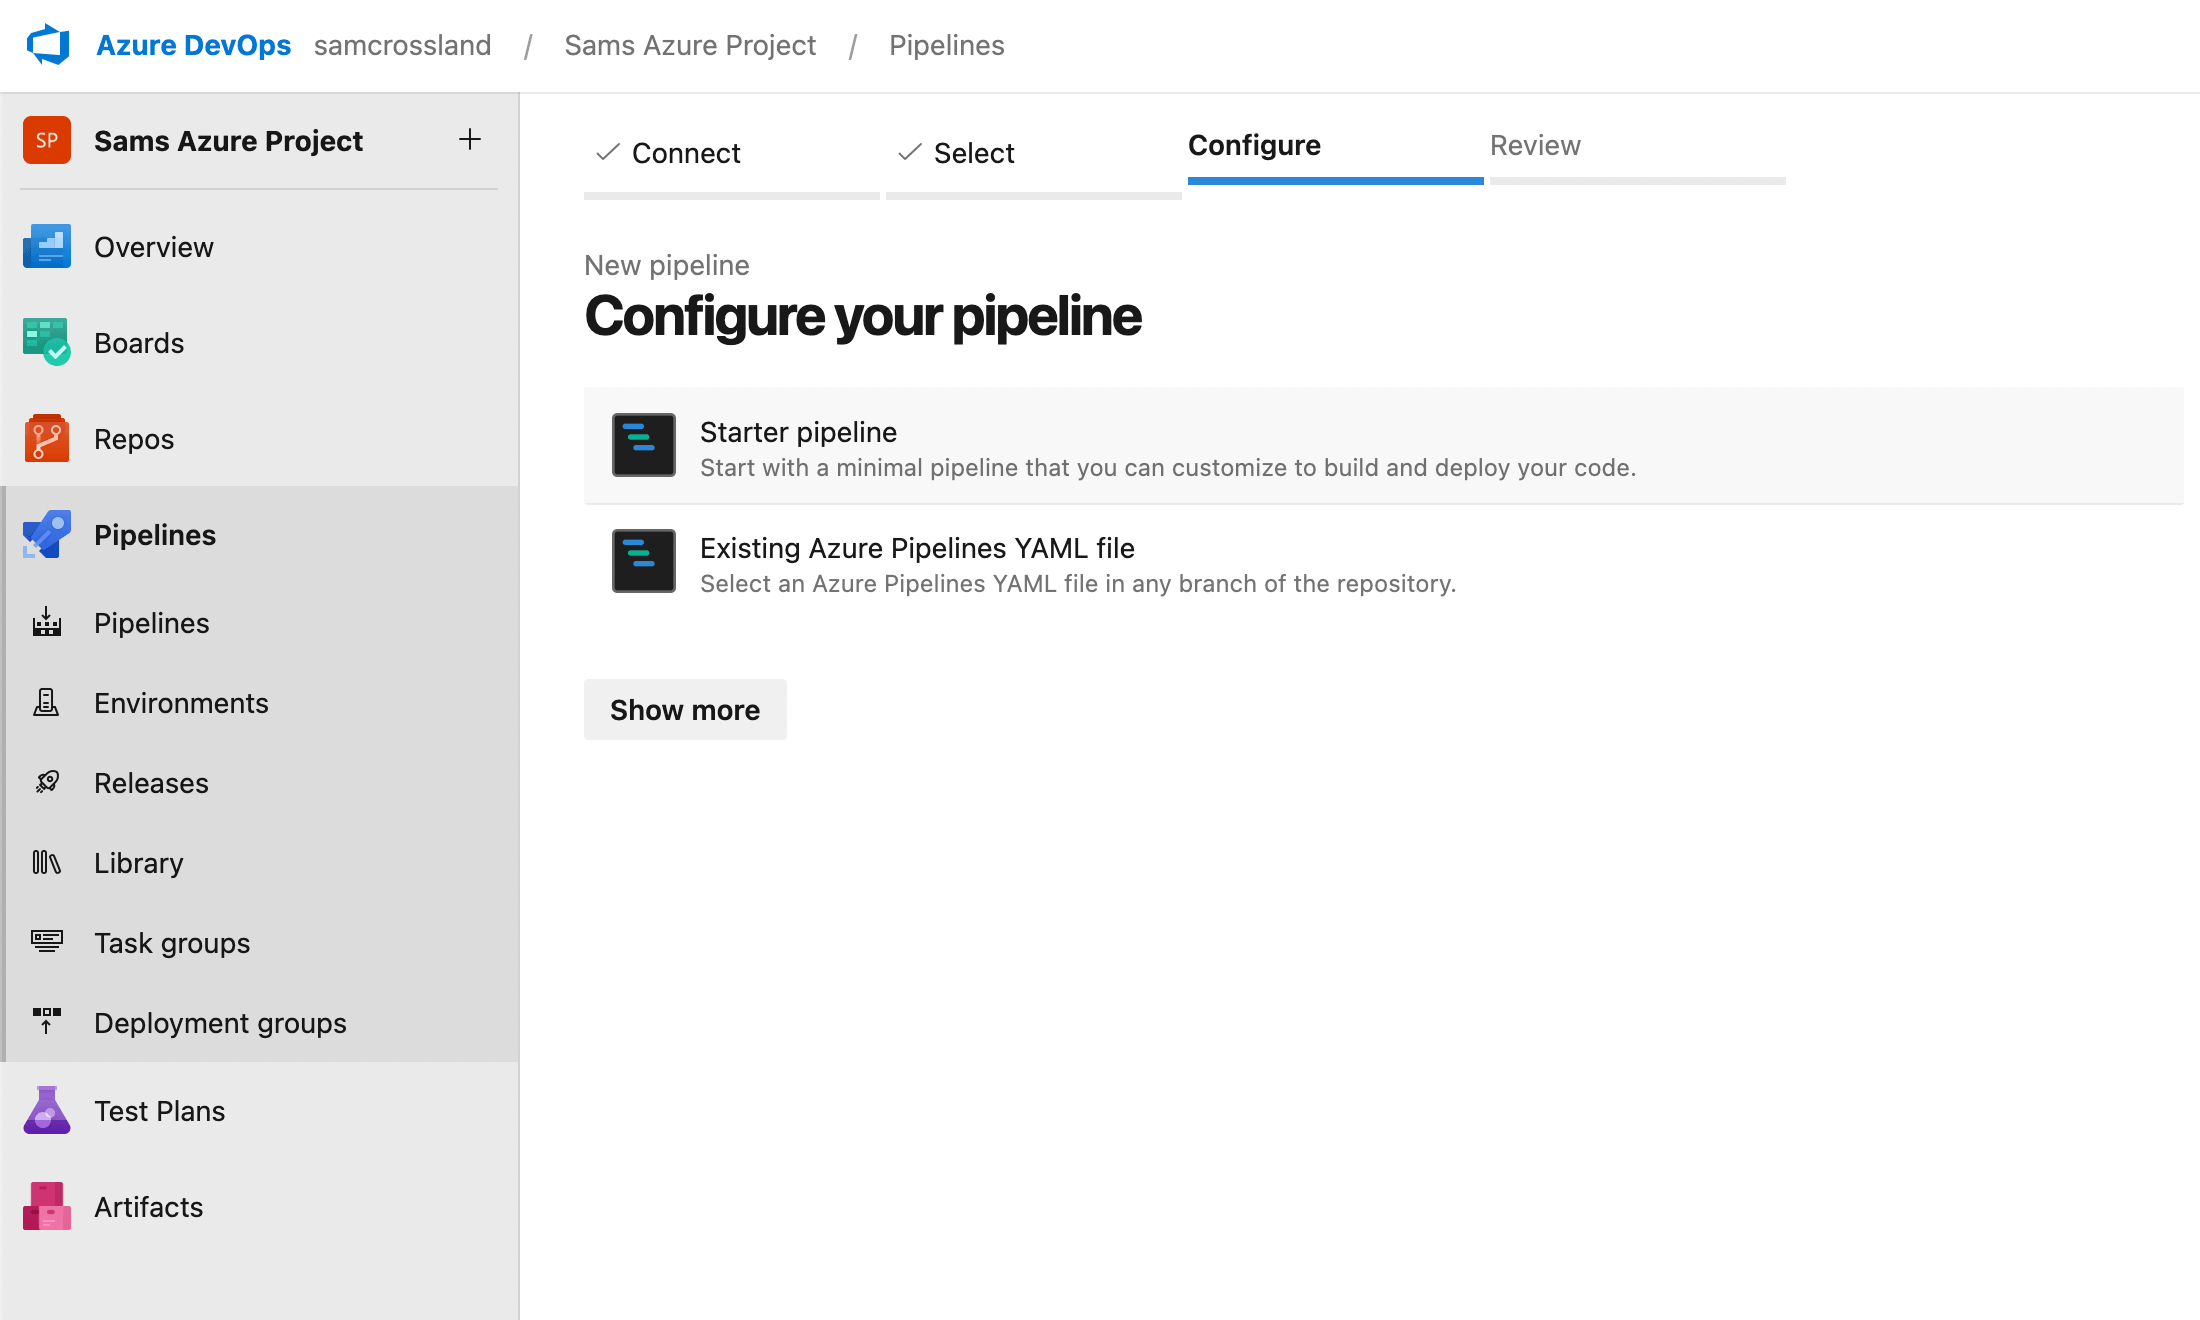
Make sure you select a Starter Pipeline to build a new one up and follow the steps below. Don’t click Save & Run until you’ve completed the next step.
Step 4: Review your pipeline YAML
Set up as a fresh YAML file — this is the “engine” behind SFCA running and posting the status back to the PR and/or running against full branches, depending on your configuration.
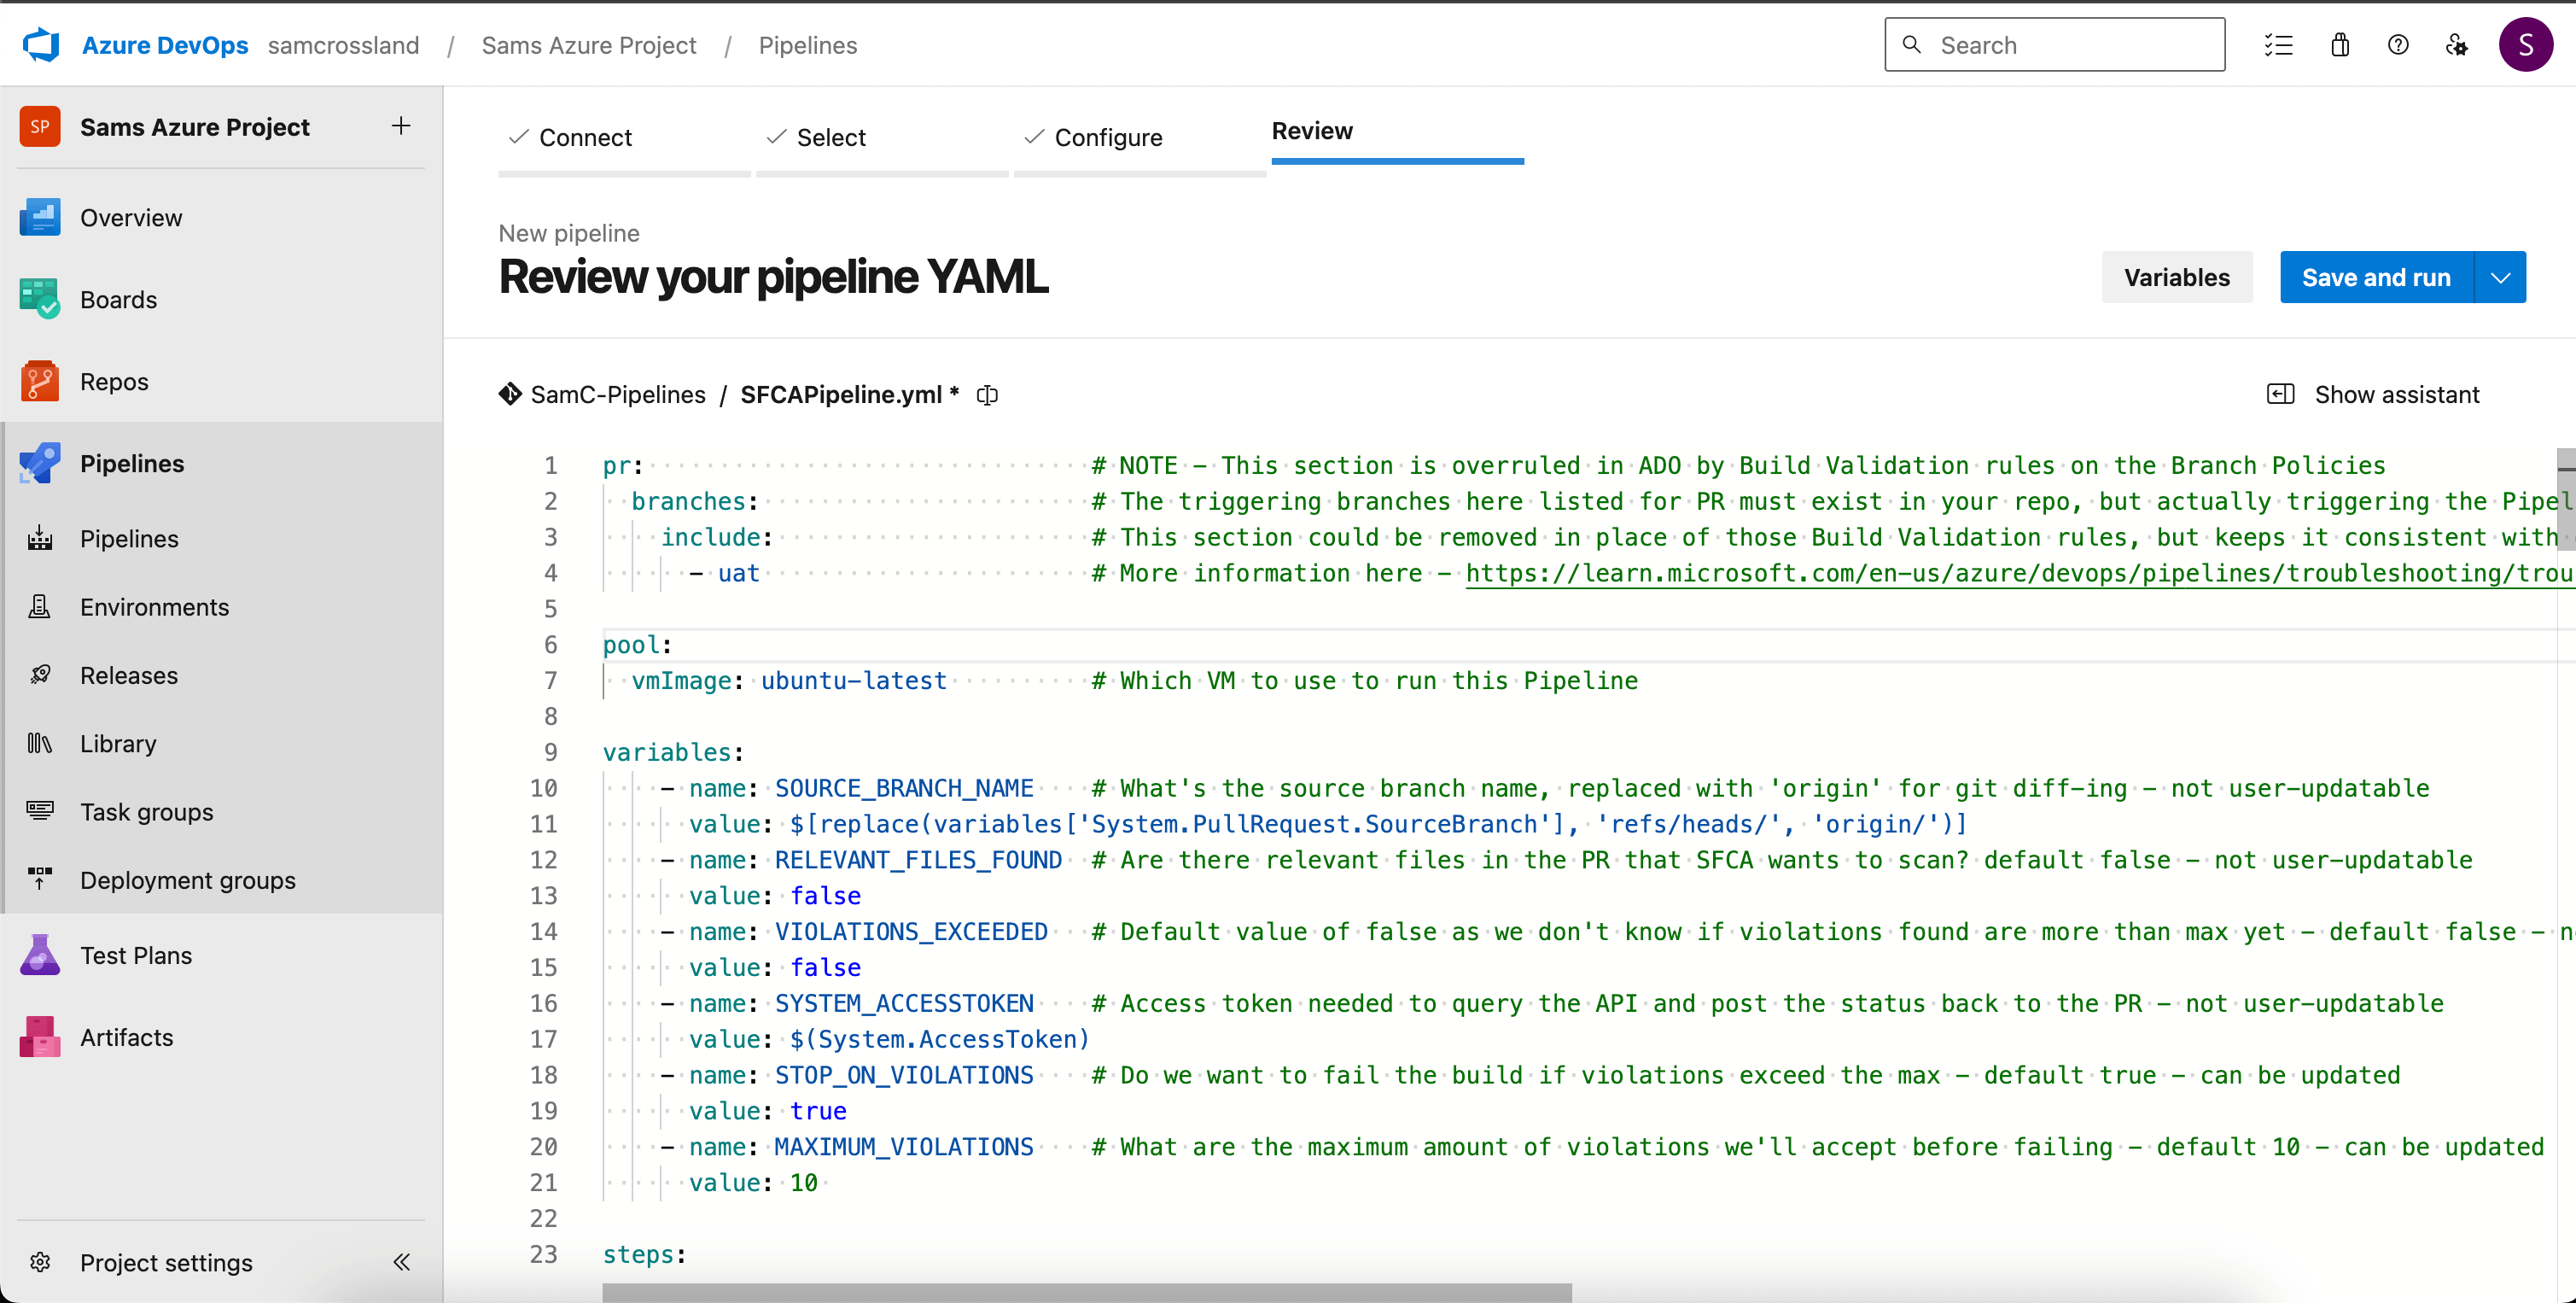
As per the guidance on the Overview and Usage sections of the extension, delete all starter pipeline code presented, and copy in the example usage block here. The custom task will also be searchable in the Tasks section on the right hand side so you can see the parameters, tweak them as needed, and insert them into a custom pipeline if needed. You can then tweak the parameters as required (e.g using “useSeverityThreshold” to dictate whether you fail on total count of violations, or only violations above a particular severity) and then get ready to save the pipeline.
Some key elements to note:
- Trigger and PR sections at the top — deliberately none to prevent triggering this on commits, and let branch policies dictate running for PRs.
- Latest ubuntu image used as a lightweight runner with key items pre-installed.
- Checkout with depth of 0 - prevents the need to overwrite “shallow fetch” elsewhere, and forces all the history to come down instead of default 1.
- Checks for NodeJS and Python here instead of inside the task.
- Allows you to specify variables (noted here), but most are defaulted anyway. If you add the custom task via the list on the right, instead of copying in the example from the repository, it will only layer in any overridden inputs you’ve selected and leave the rest as default.
Now you’ve got our pipeline YAML configured, you can move on to the next steps to save it and get testing.
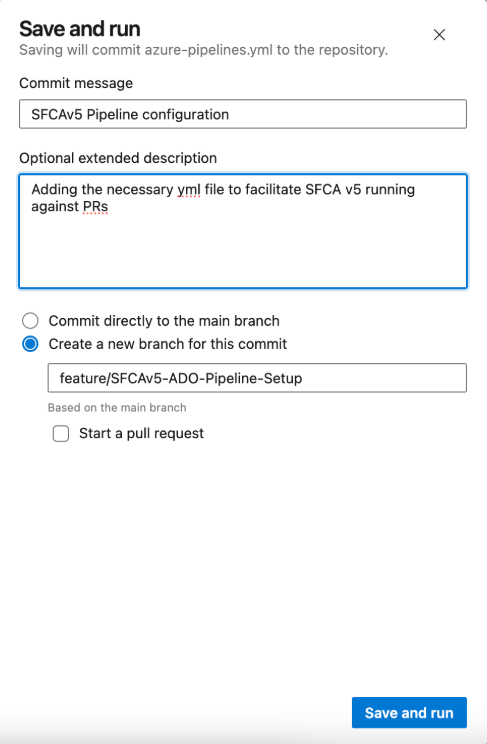
Step 5: Save the pipeline YAML file to a new branch
In Azure DevOps, click Save & Run to save your new pipeline YAML file. When prompted, create a new branch for this change. When naming your branch, use a name that reflects the addition of a pipeline automation file (rather than Salesforce metadata) — e.g. “feature/SFCAv5-ADO-Pipeline-Setup”. For now, untick the pre-selected PR option during save. This YAML file will eventually be needed in all relevant branches, but we'll complete other setup steps first.
Step 6: Configure branch policies and build validation
To ensure your pipeline runs as intended, you’ll need to set up a Branch Policy on the branch where you want the pipeline to trigger — for example, your user acceptance testing (UAT) branch. This can apply to one or multiple branches, depending on your version control structure and testing requirements.
Top tip: During testing, I actually found it easier to use the branch above, containing the new YAML file, as the policy target. This meant I could raise PRs to this branch from other branches, and test the functionality before propagating it elsewhere.
While the PR trigger in the YAML file tells it which branches to watch, Azure DevOps requires a Build Validation Policy for the pipeline to trigger on pull requests. This differs from GitHub, where the YAML trigger alone is usually enough.
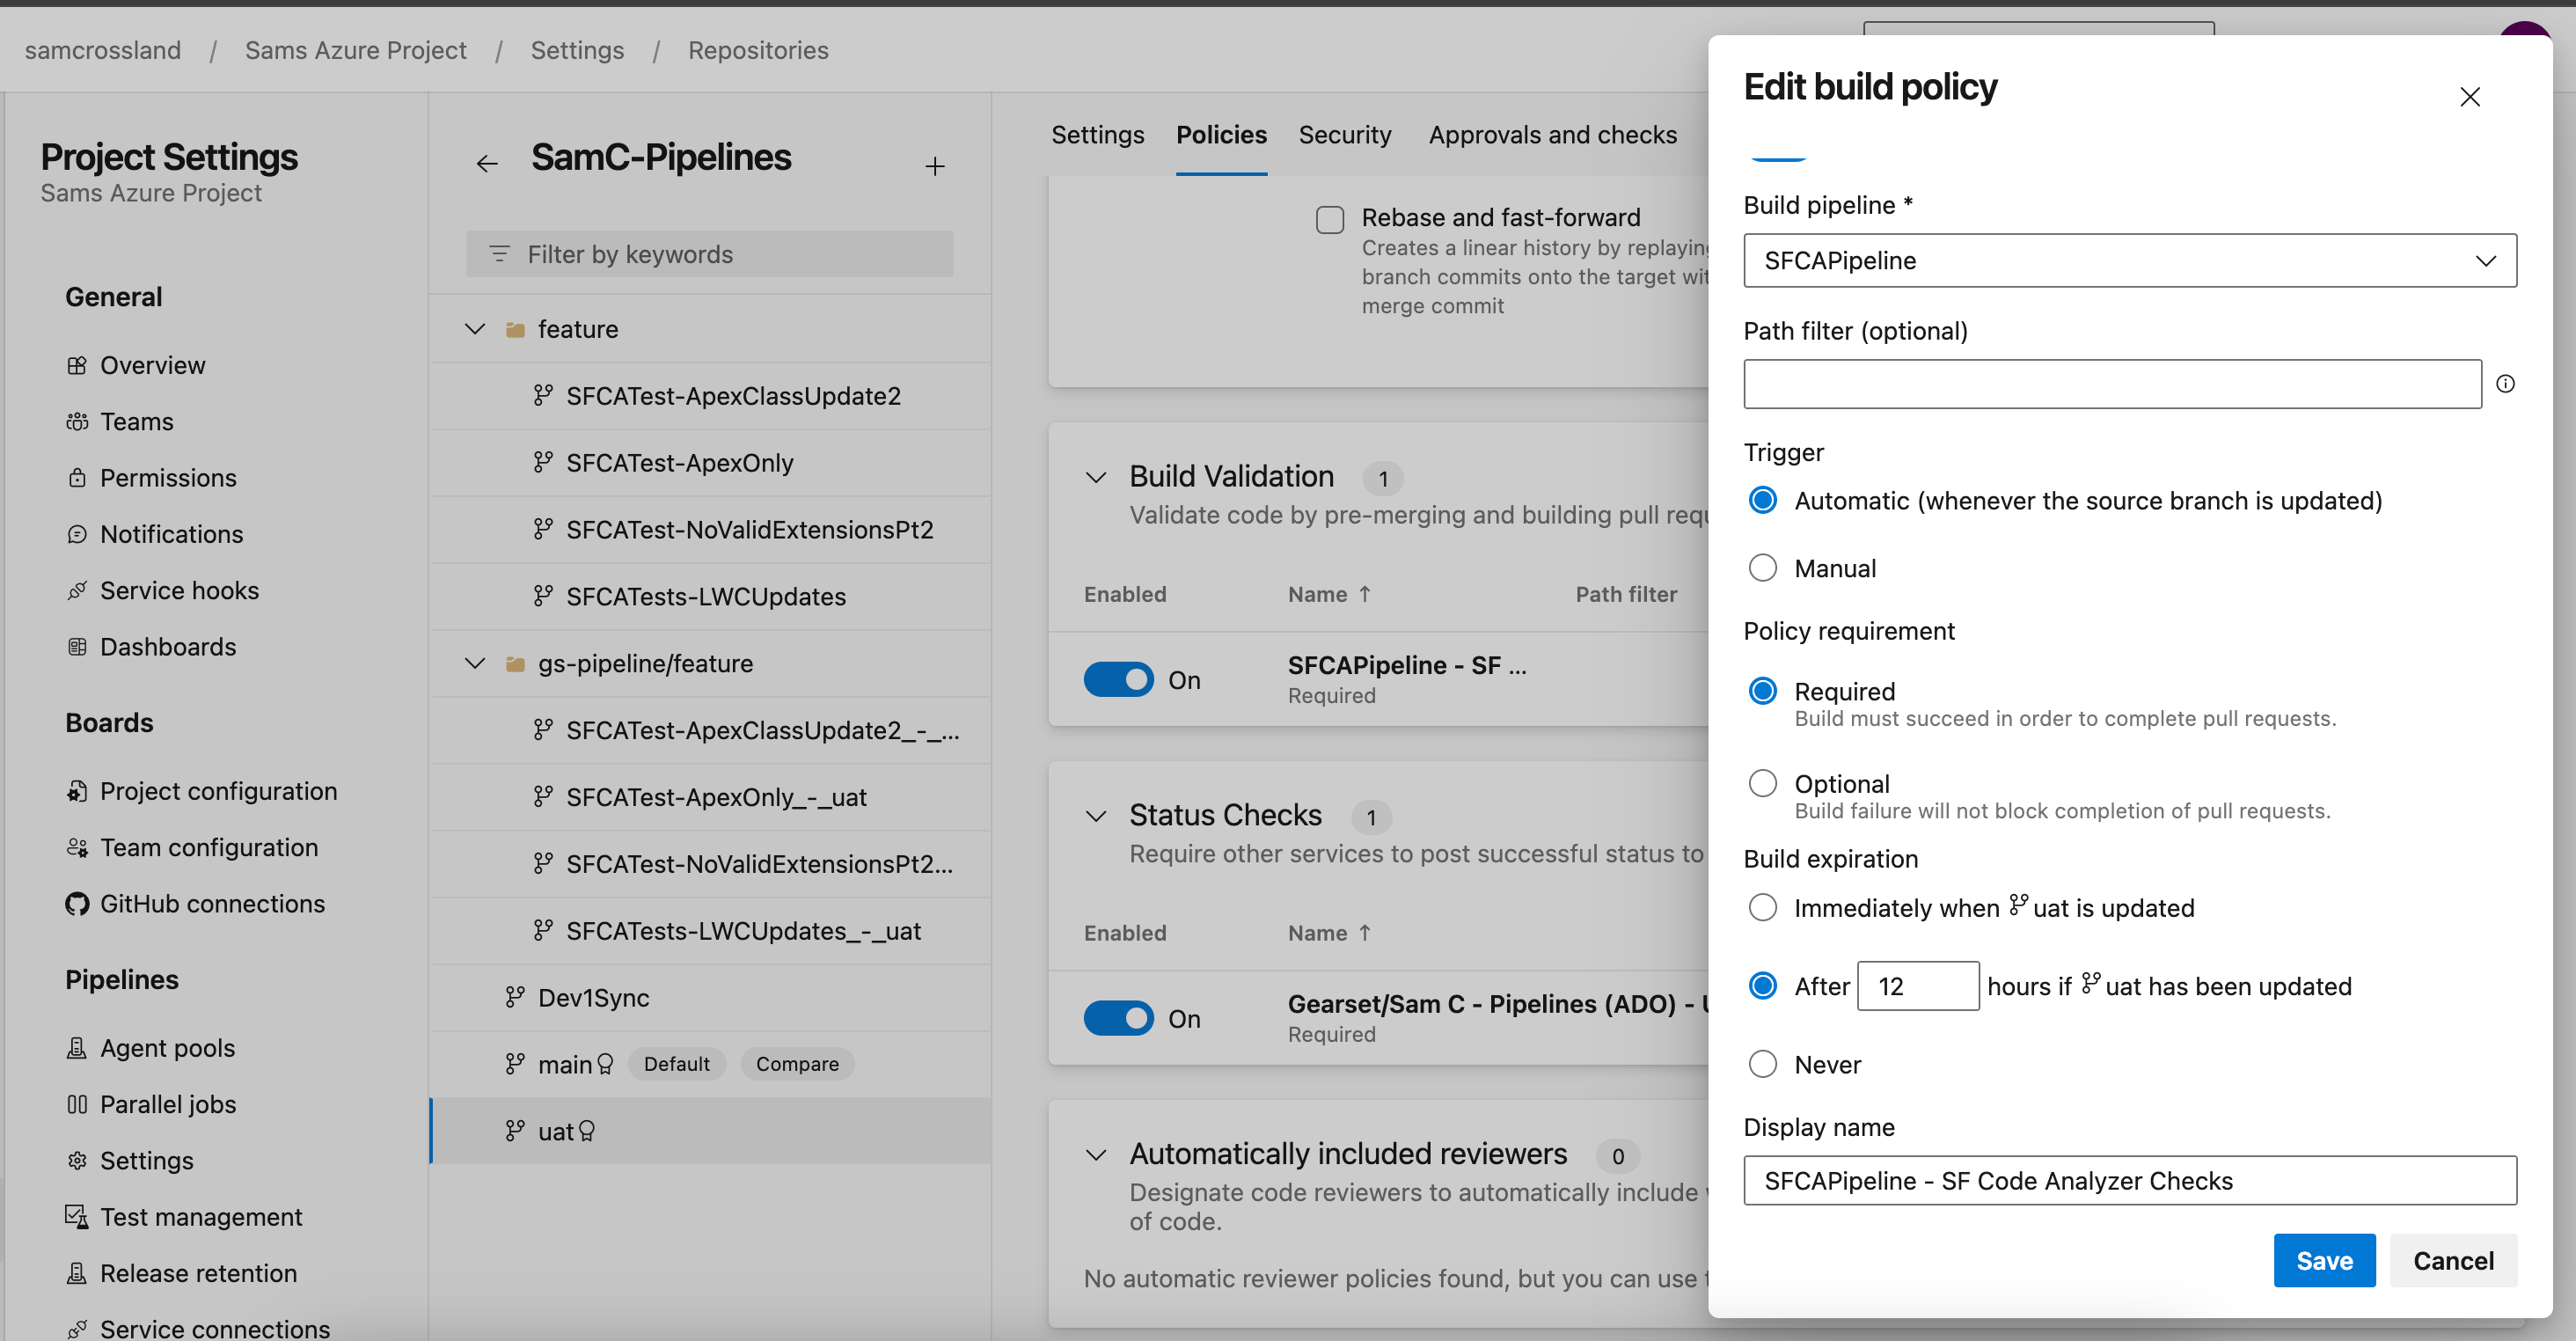
To set up your Build Validation Policy, navigate to your desired branch (e.g. UAT) in Azure DevOps. Go to Branch Policies and locate the Build Validation section where you can add a new Build Validation Policy by following these steps:
- Select your newly created pipeline.
- Set it as Required to ensure the pipeline must pass before the PR can be merged.
- Enter a clear display name (e.g. SFCA Code Analysis check) for easy identification.
- Ensure the trigger is set to run automatically for every PR targeting this branch.
- By default, PR build results are retained for 10 days. Make sure to review your retention policies to adjust this period if longer-term build history is required.
By default, PR build results are retained for 10 days. Make sure to review your retention policies to adjust this period if longer-term build history is required.
Step 7: Verify your file structure
In the parent folder of your branch, make sure the file structure includes the necessary YAML files to enable SFCA scanning and manage code coverage. These files should sit alongside your Salesforce metadata.
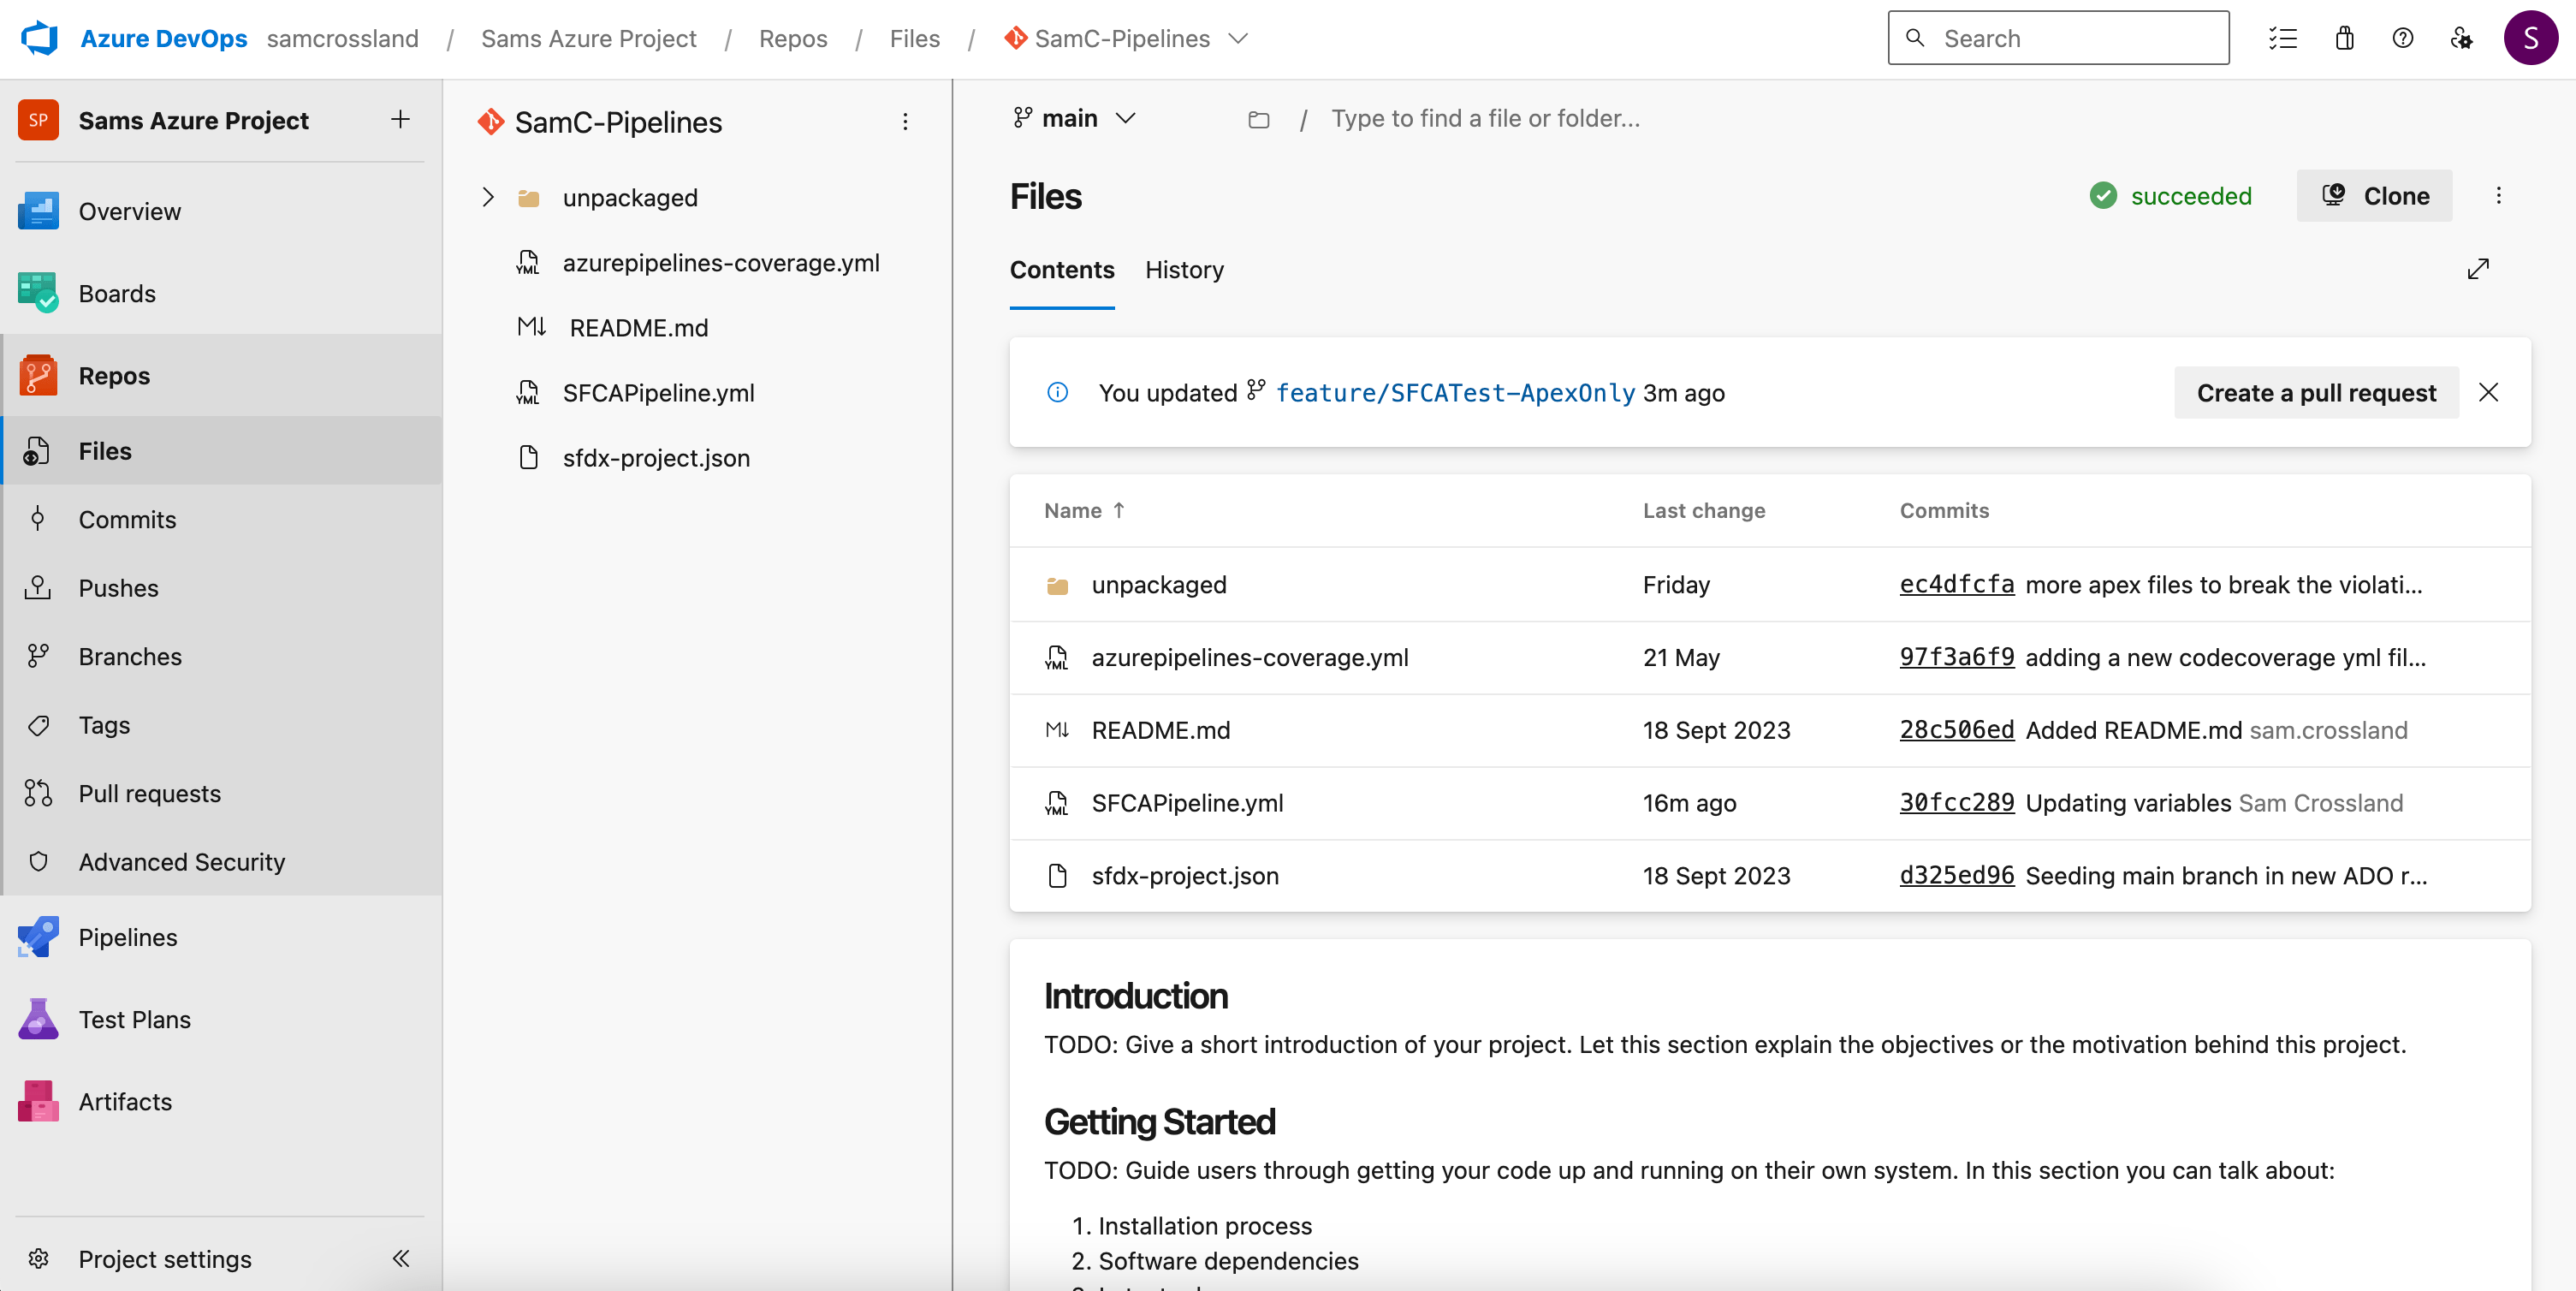
You’ll need to make sure you have the following files:
- SFCAPipeline-v5.yml — which runs the SFCA scanning process
- Codecoverage.yml — which prevents unnecessary code coverage checks running
- Your existing Salesforce metadata files (e.g. classes, objects, triggers, etc.)
Ensuring these files are placed correctly allows the pipeline to function as intended, with SFCA scanning and code coverage configurations working seamlessly.
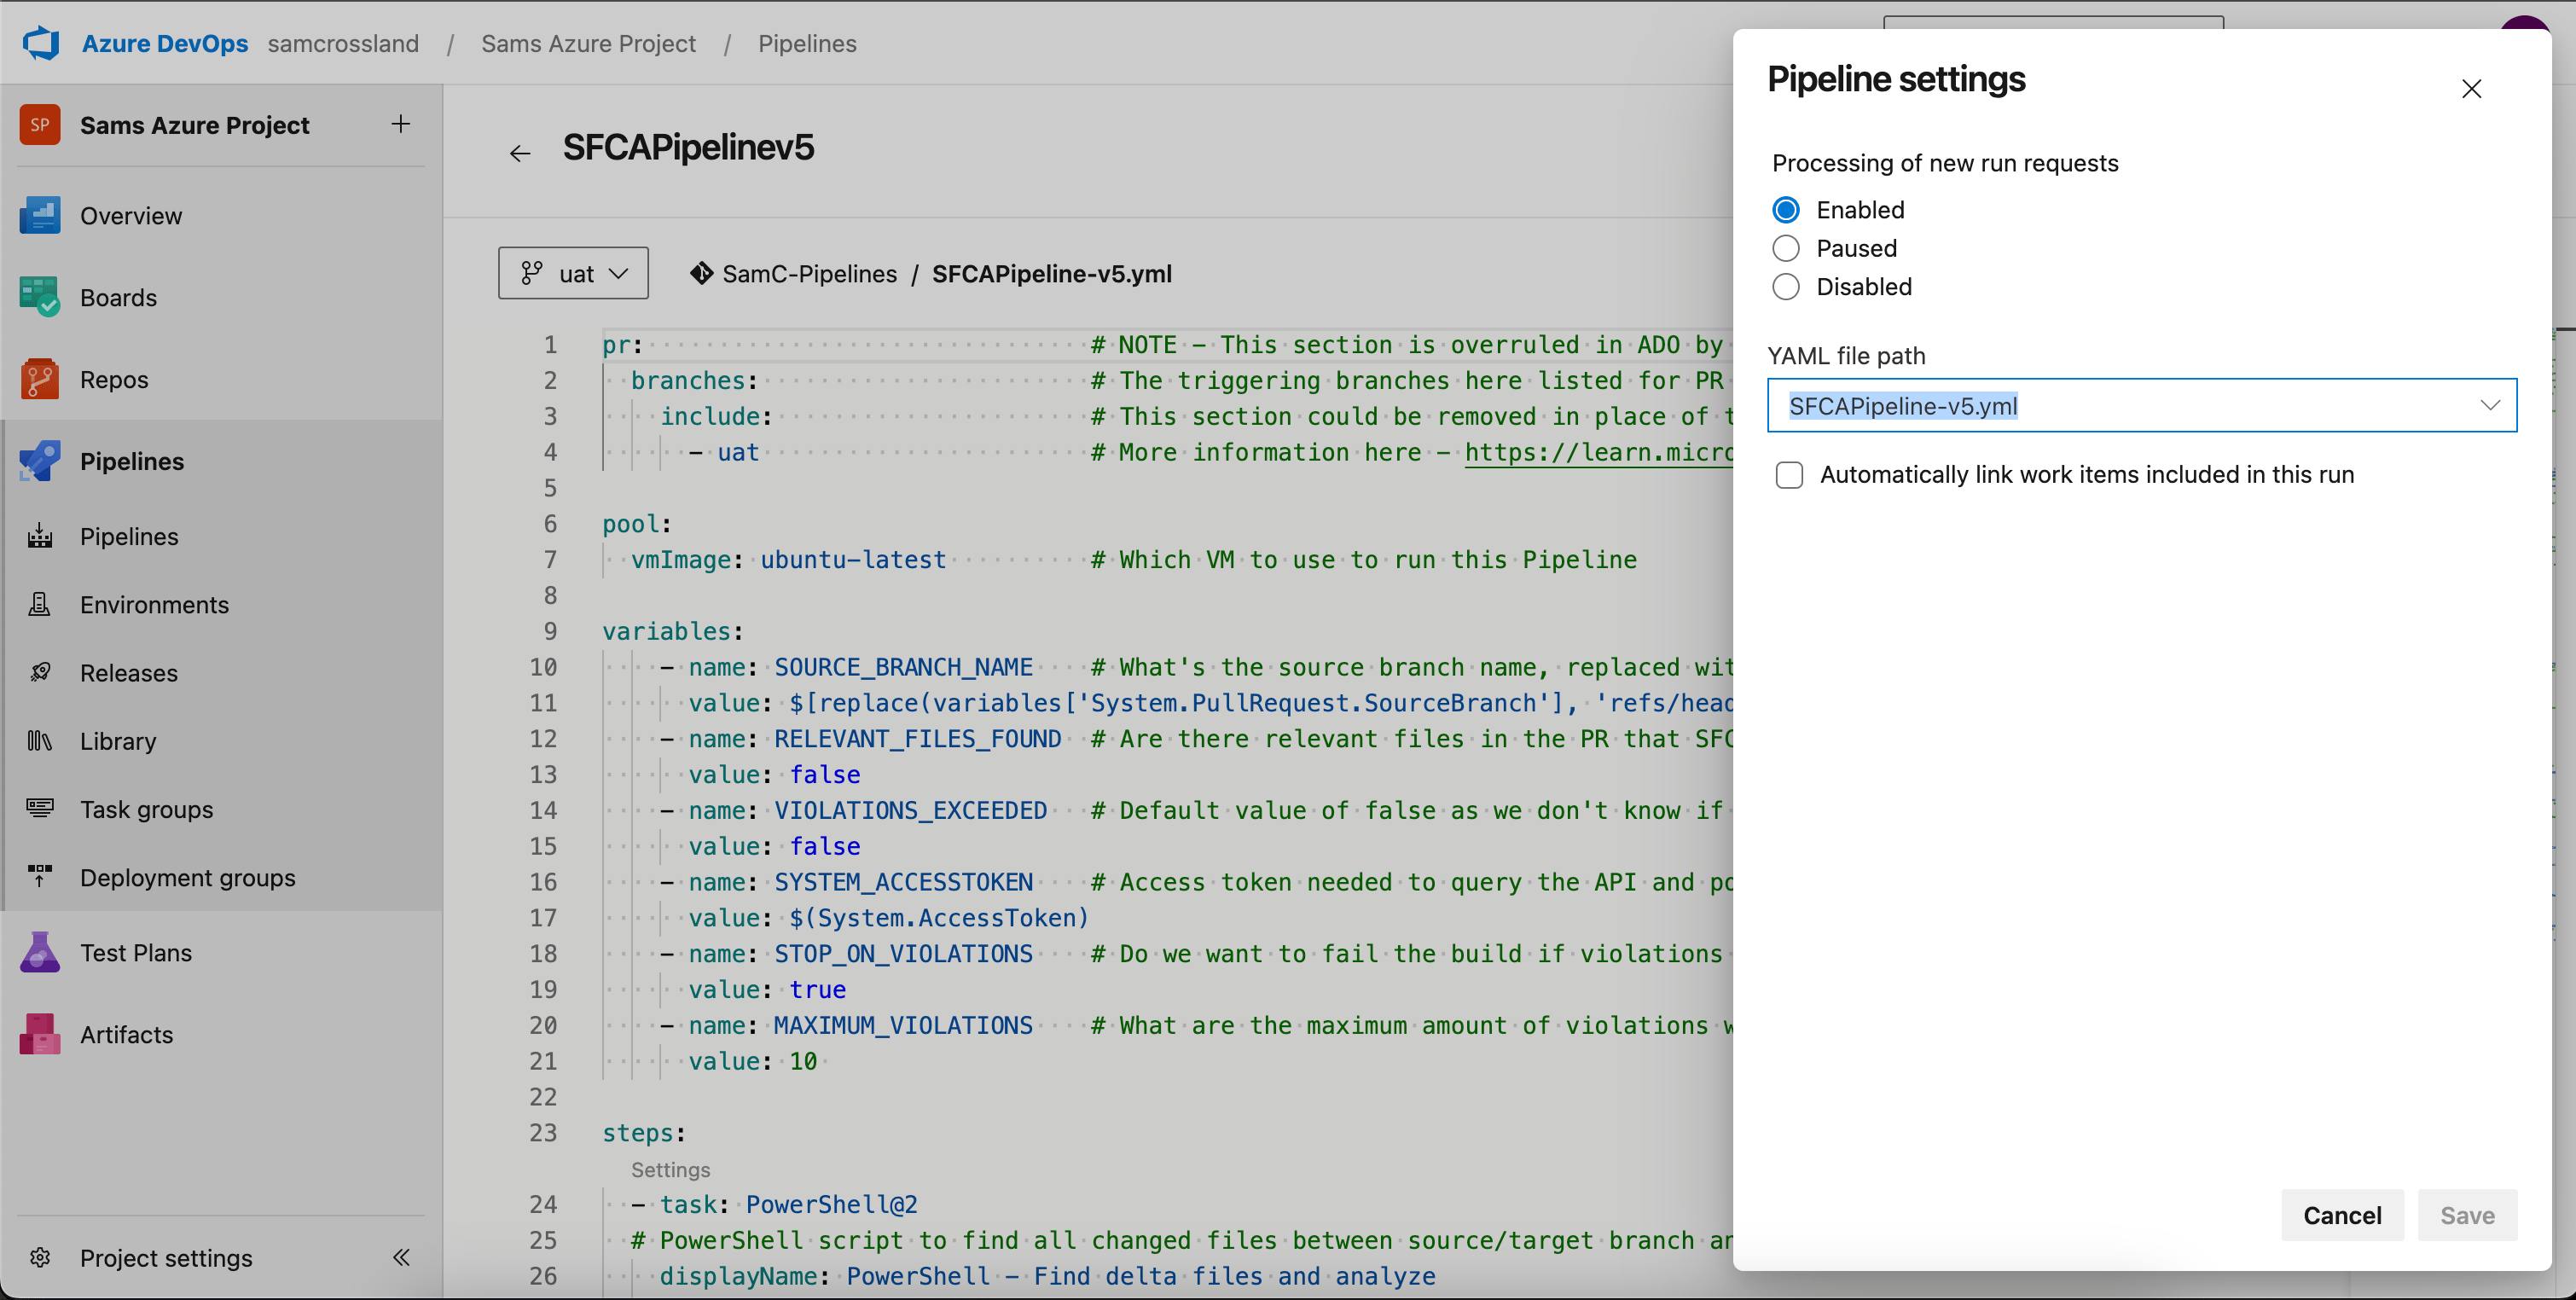
Step 8: Verify your pipeline settings
To avoid errors like “configuring the trigger failed, edit and save the pipeline again”, ensure your ADO pipeline settings are pointing to the correct YAML file (e.g. SFCAPipeline-v5.yml) rather than the default configuration. You can check and update the YAML file path with the following steps:
- In Azure DevOps, navigate to Pipelines.
- Click on your created pipeline to open it.
- In the top-right corner, click the three dots (⋮) and select Settings.
- In the YAML file path field, ensure it points to the correct file (e.g. SFCAPipeline-v5.yml).
Step 9: Final configuration adjustments
With your ADO pipeline set up, there are two final adjustments to ensure it runs successfully.
Update permissions for status check pushback
To allow the pipeline to post the final status check/comments back to the PR, the Build Service User needs appropriate permissions. To update the permissions follow these steps:
- Navigate to Project Settings in Azure DevOps.
- Go to Repositories and select the repository where the pipeline exists.
- Click the Security tab.
- Scroll down and find the Build Service User (listed near the bottom).
- Locate the Contribute to pull requests permission and set it to Allow.
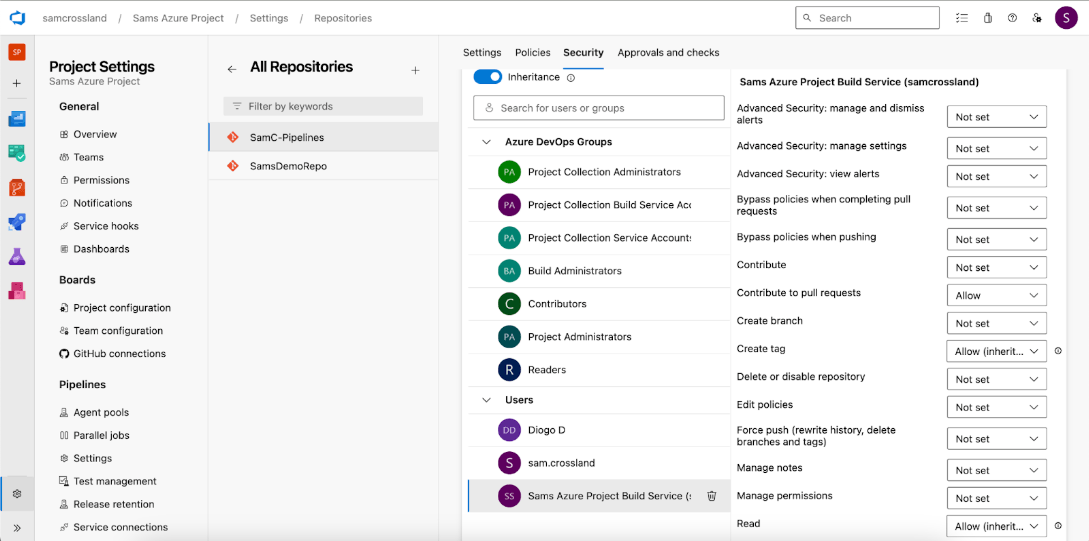
Without this permission, the pipeline won’t be able to push its status back into the PR, which could cause incomplete checks or workflow interruptions.
Step 10: Test the pipeline with a pull request and branch scan
Create a PR from a feature branch into your target branch (e.g. UAT, or whichever branch contains the new YAML file). This allows you to test the pipeline setup against branches containing legitimate Salesforce code. Once the PR is raised, if the ADO build policy has been configured correctly, you should see the pipeline queue. Then, when an agent becomes available, the pipeline check will begin to run, allowing you to track its progress.
Create and test at least two PRs against the target branch:
- Test PR 1: Contains valid files for scanning (e.g. .cls, .js, .html, or even Flows) — expect the pipeline to run and return scan results.
- Test PR 2: Contains non-scannable files (e.g. .xml) — the pipeline should recognize there’s nothing to scan and skip unnecessary steps, meaning no report will be generated.
The goal of these tests is to confirm that the Azure DevOps pipeline behaves as expected before rolling out the PR to other branches.
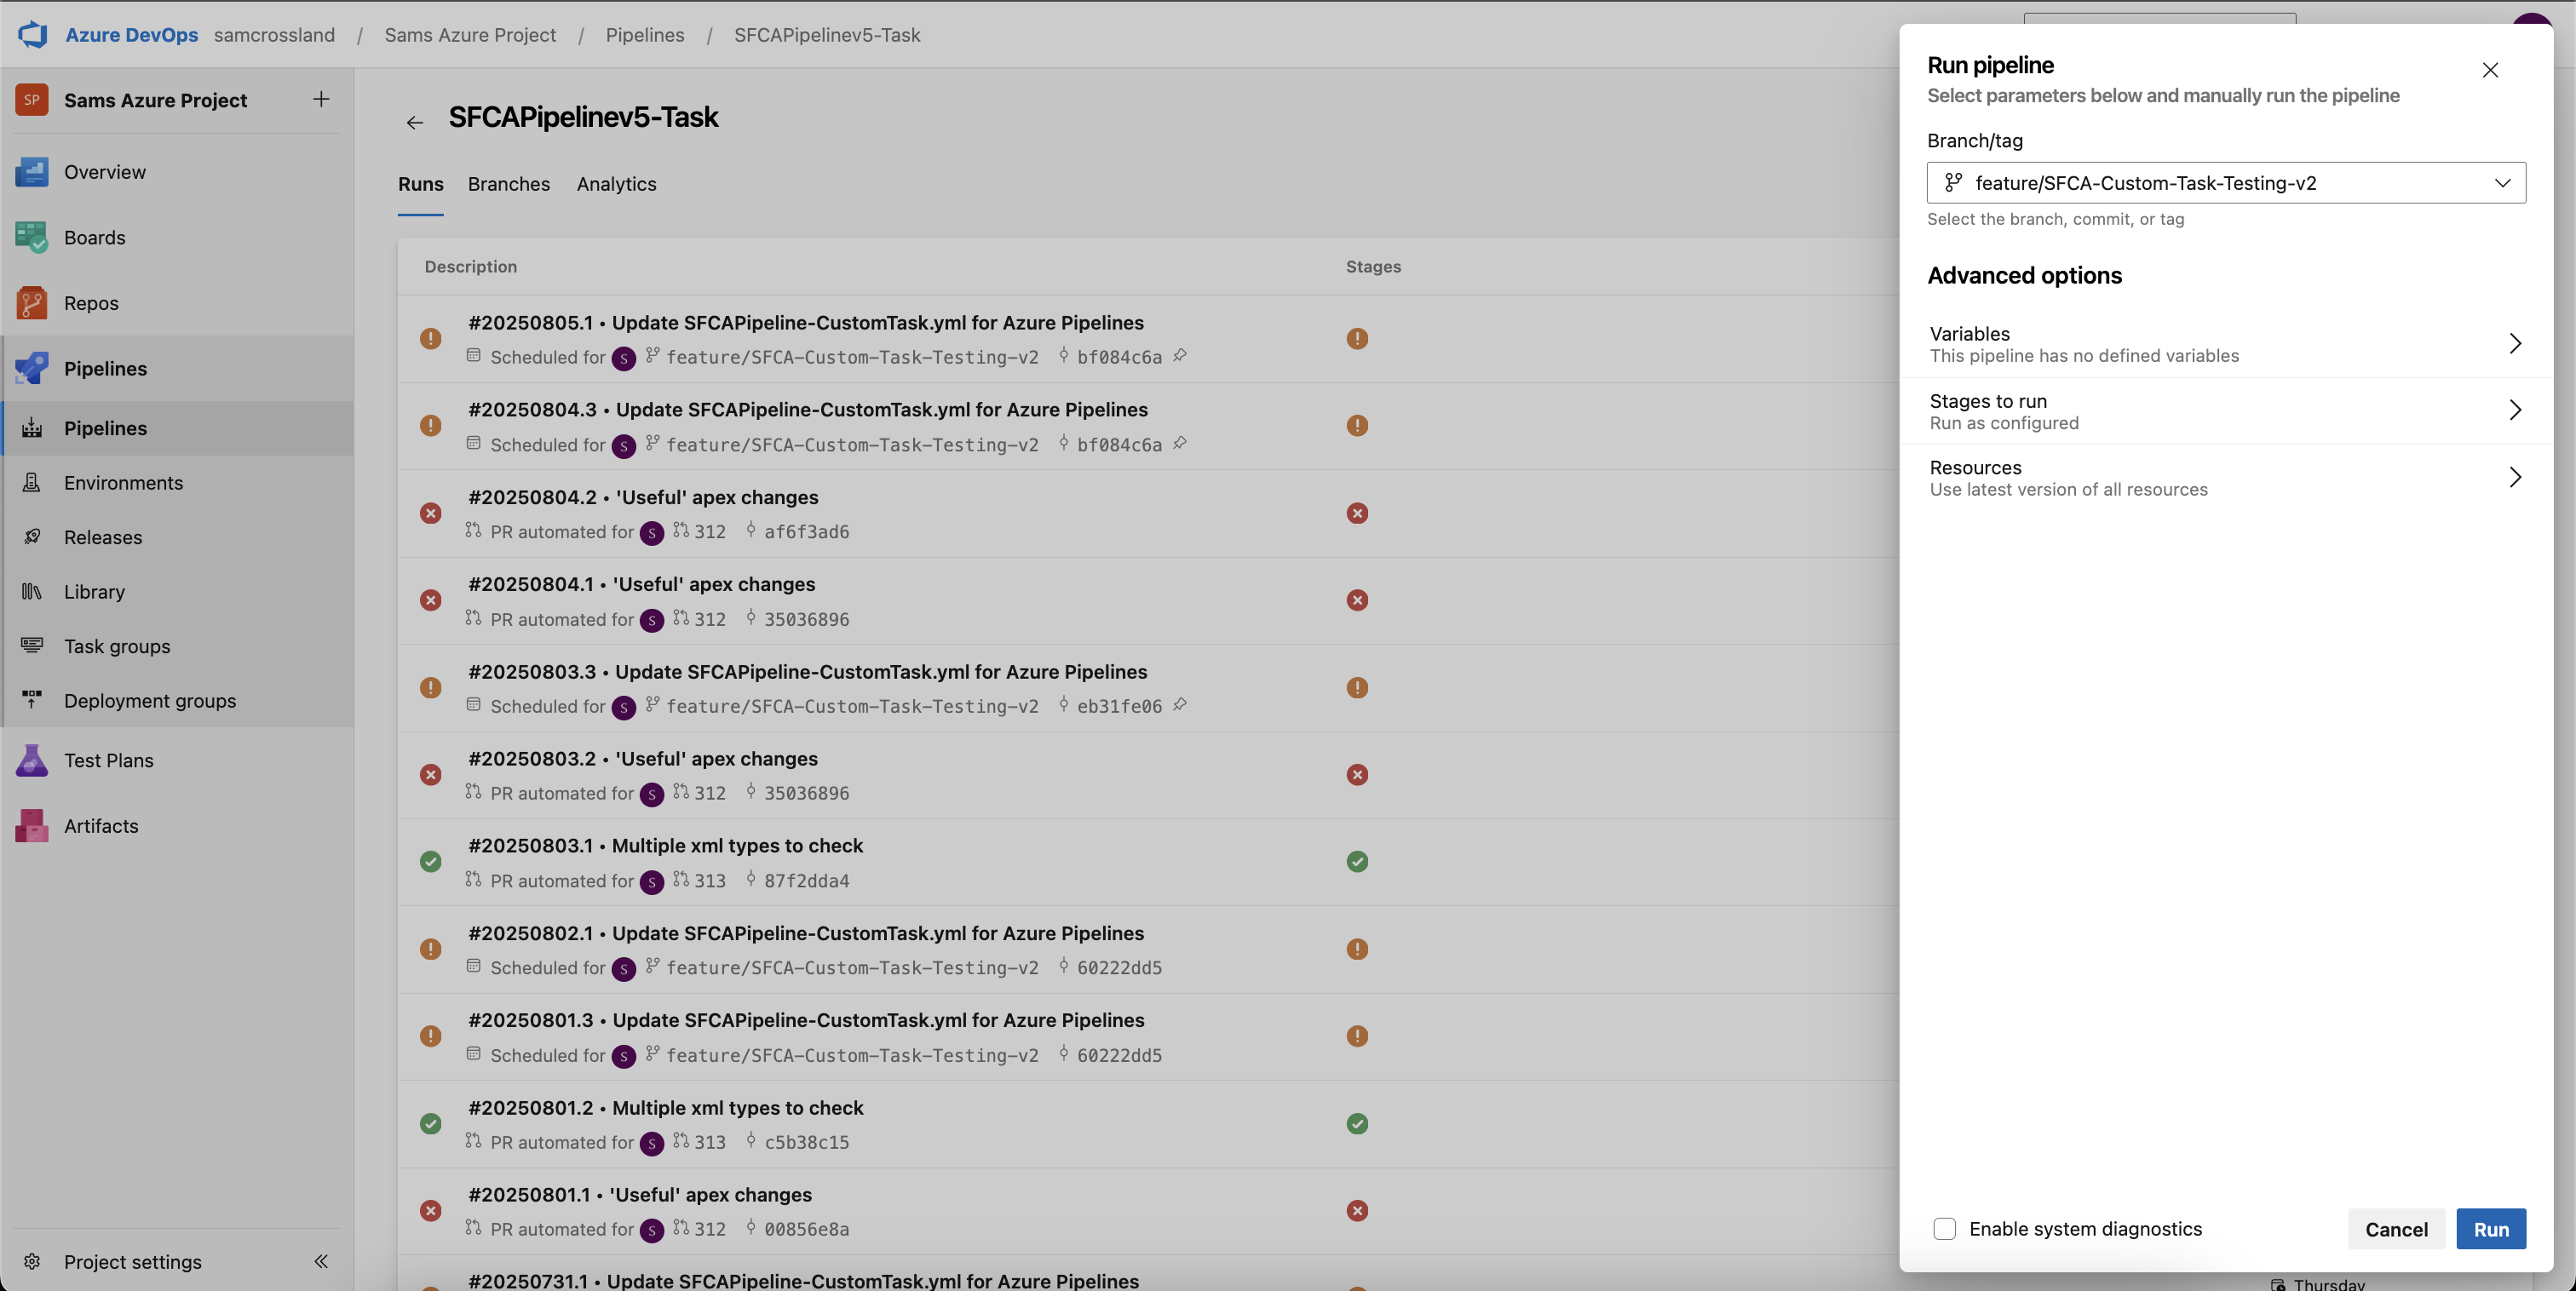
If your configuration includes full branch scans, you can also verify it’s functioning as expected by using the “Run pipeline” button from the ADO Pipelines view, selecting your branch, and clicking “Run”. If you have a “schedule” in your yml file, this would then run the full branch scan at pre-determined intervals.
Step 11: Roll out to all relevant branches
Once you’re satisfied that the pipeline is working as expected, you’ll need to get it into all of your other long-term branches where you may want it to run (SIT, UAT, Main, etc.). You can do this by creating a PR from the feature branch containing your .yml file (the pipeline itself), into those long-term branches. Then continue to sync all of them until you reach your Main/Master branch. You should also propagate the pipeline to all remaining branches in your codebase to ensure consistency.
Follow Step 6 again to set up branch policies for any branches where you want this pipeline to automatically trigger, and rerun some tests to ensure it’s running as expected with new PRs.
Seeing the results
Viewing results in Azure DevOps
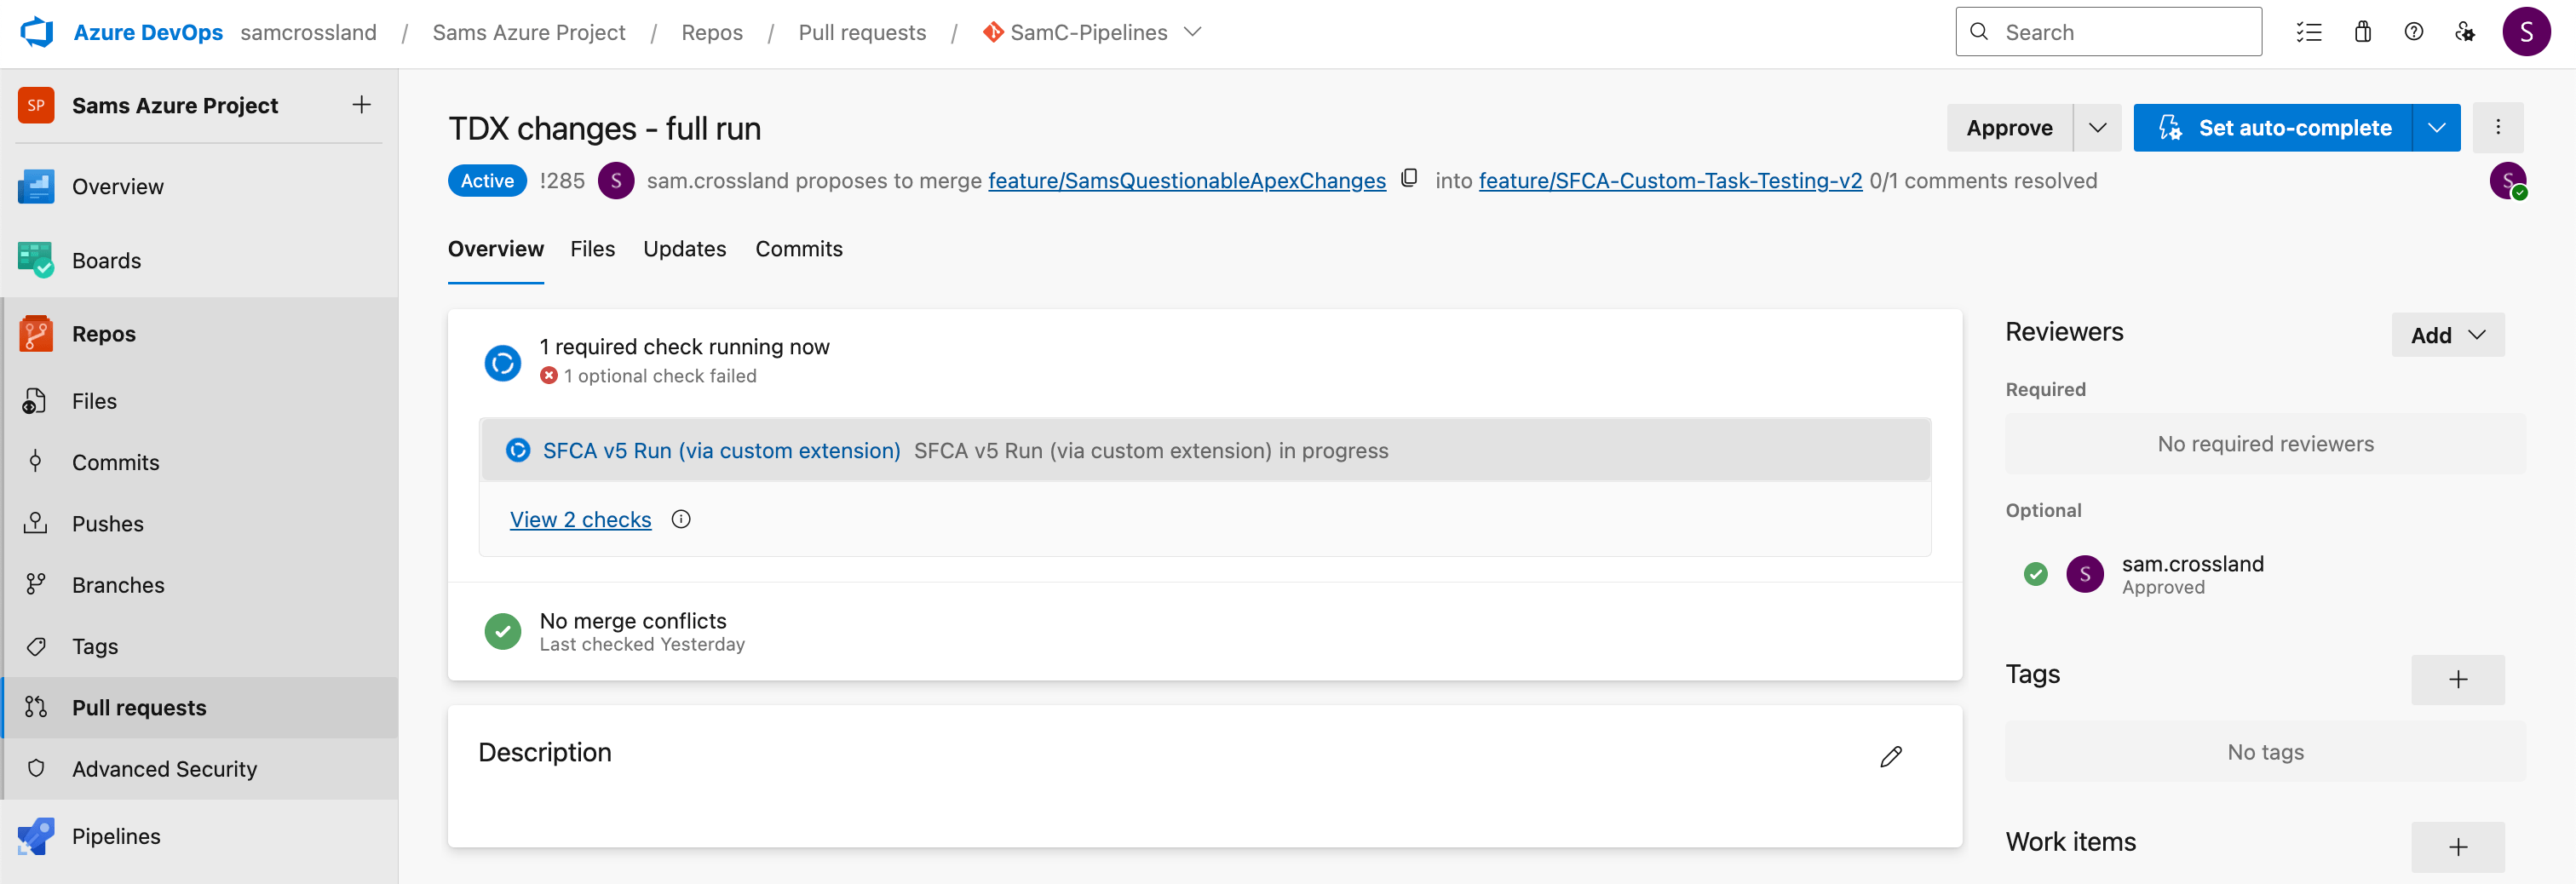
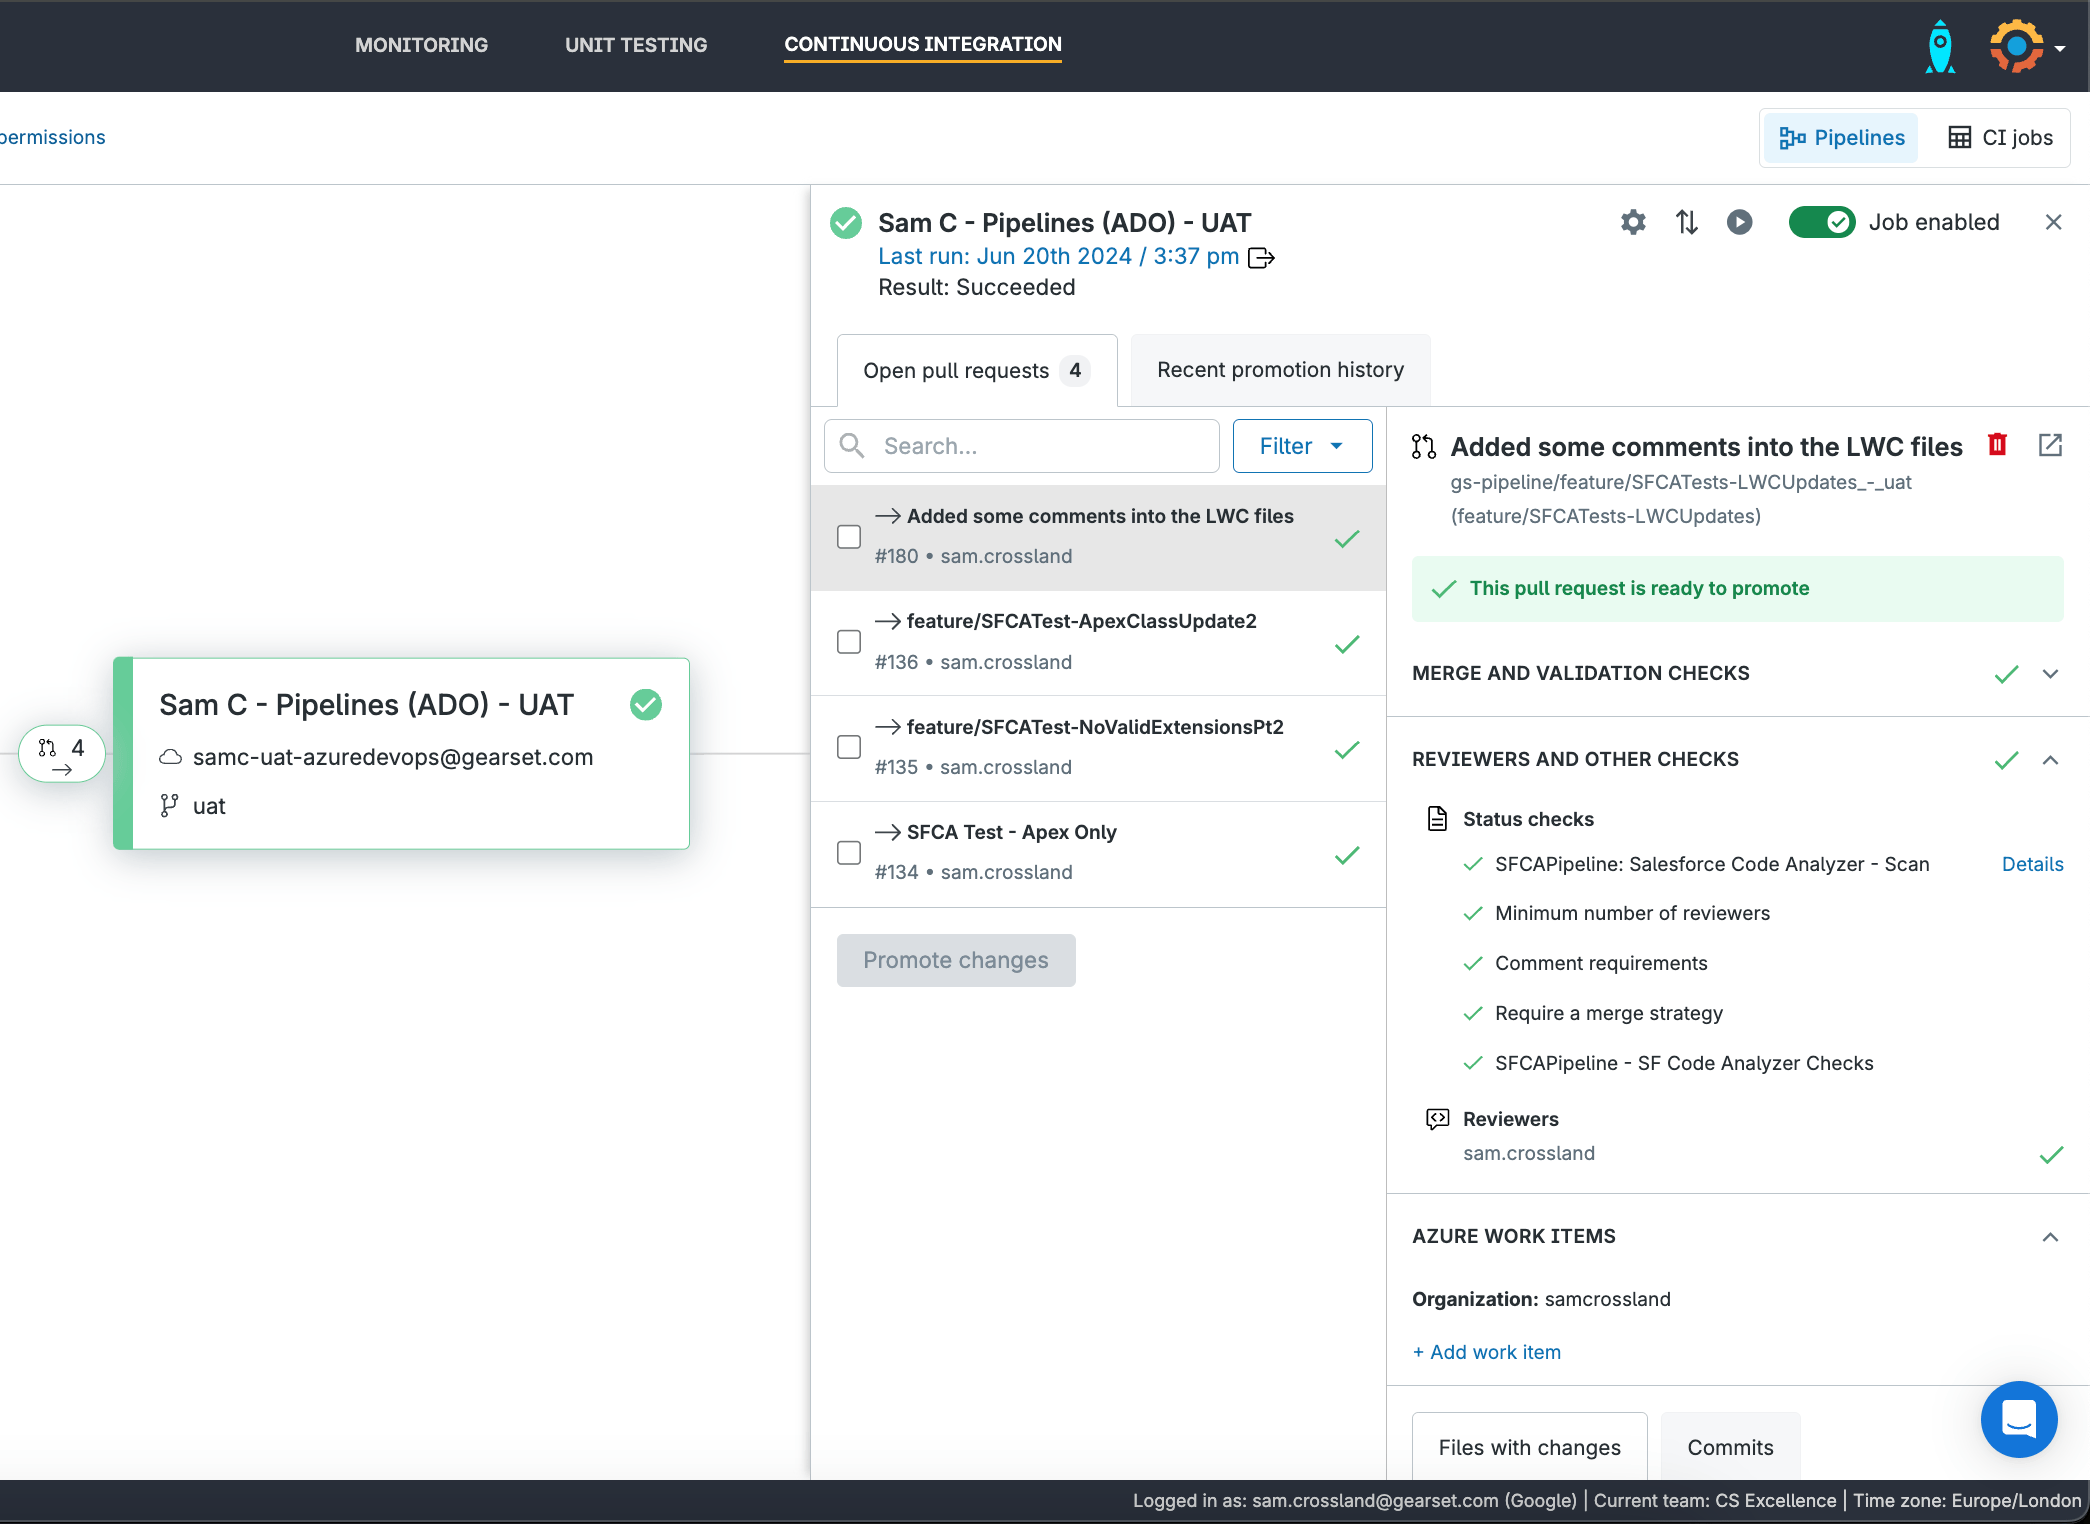
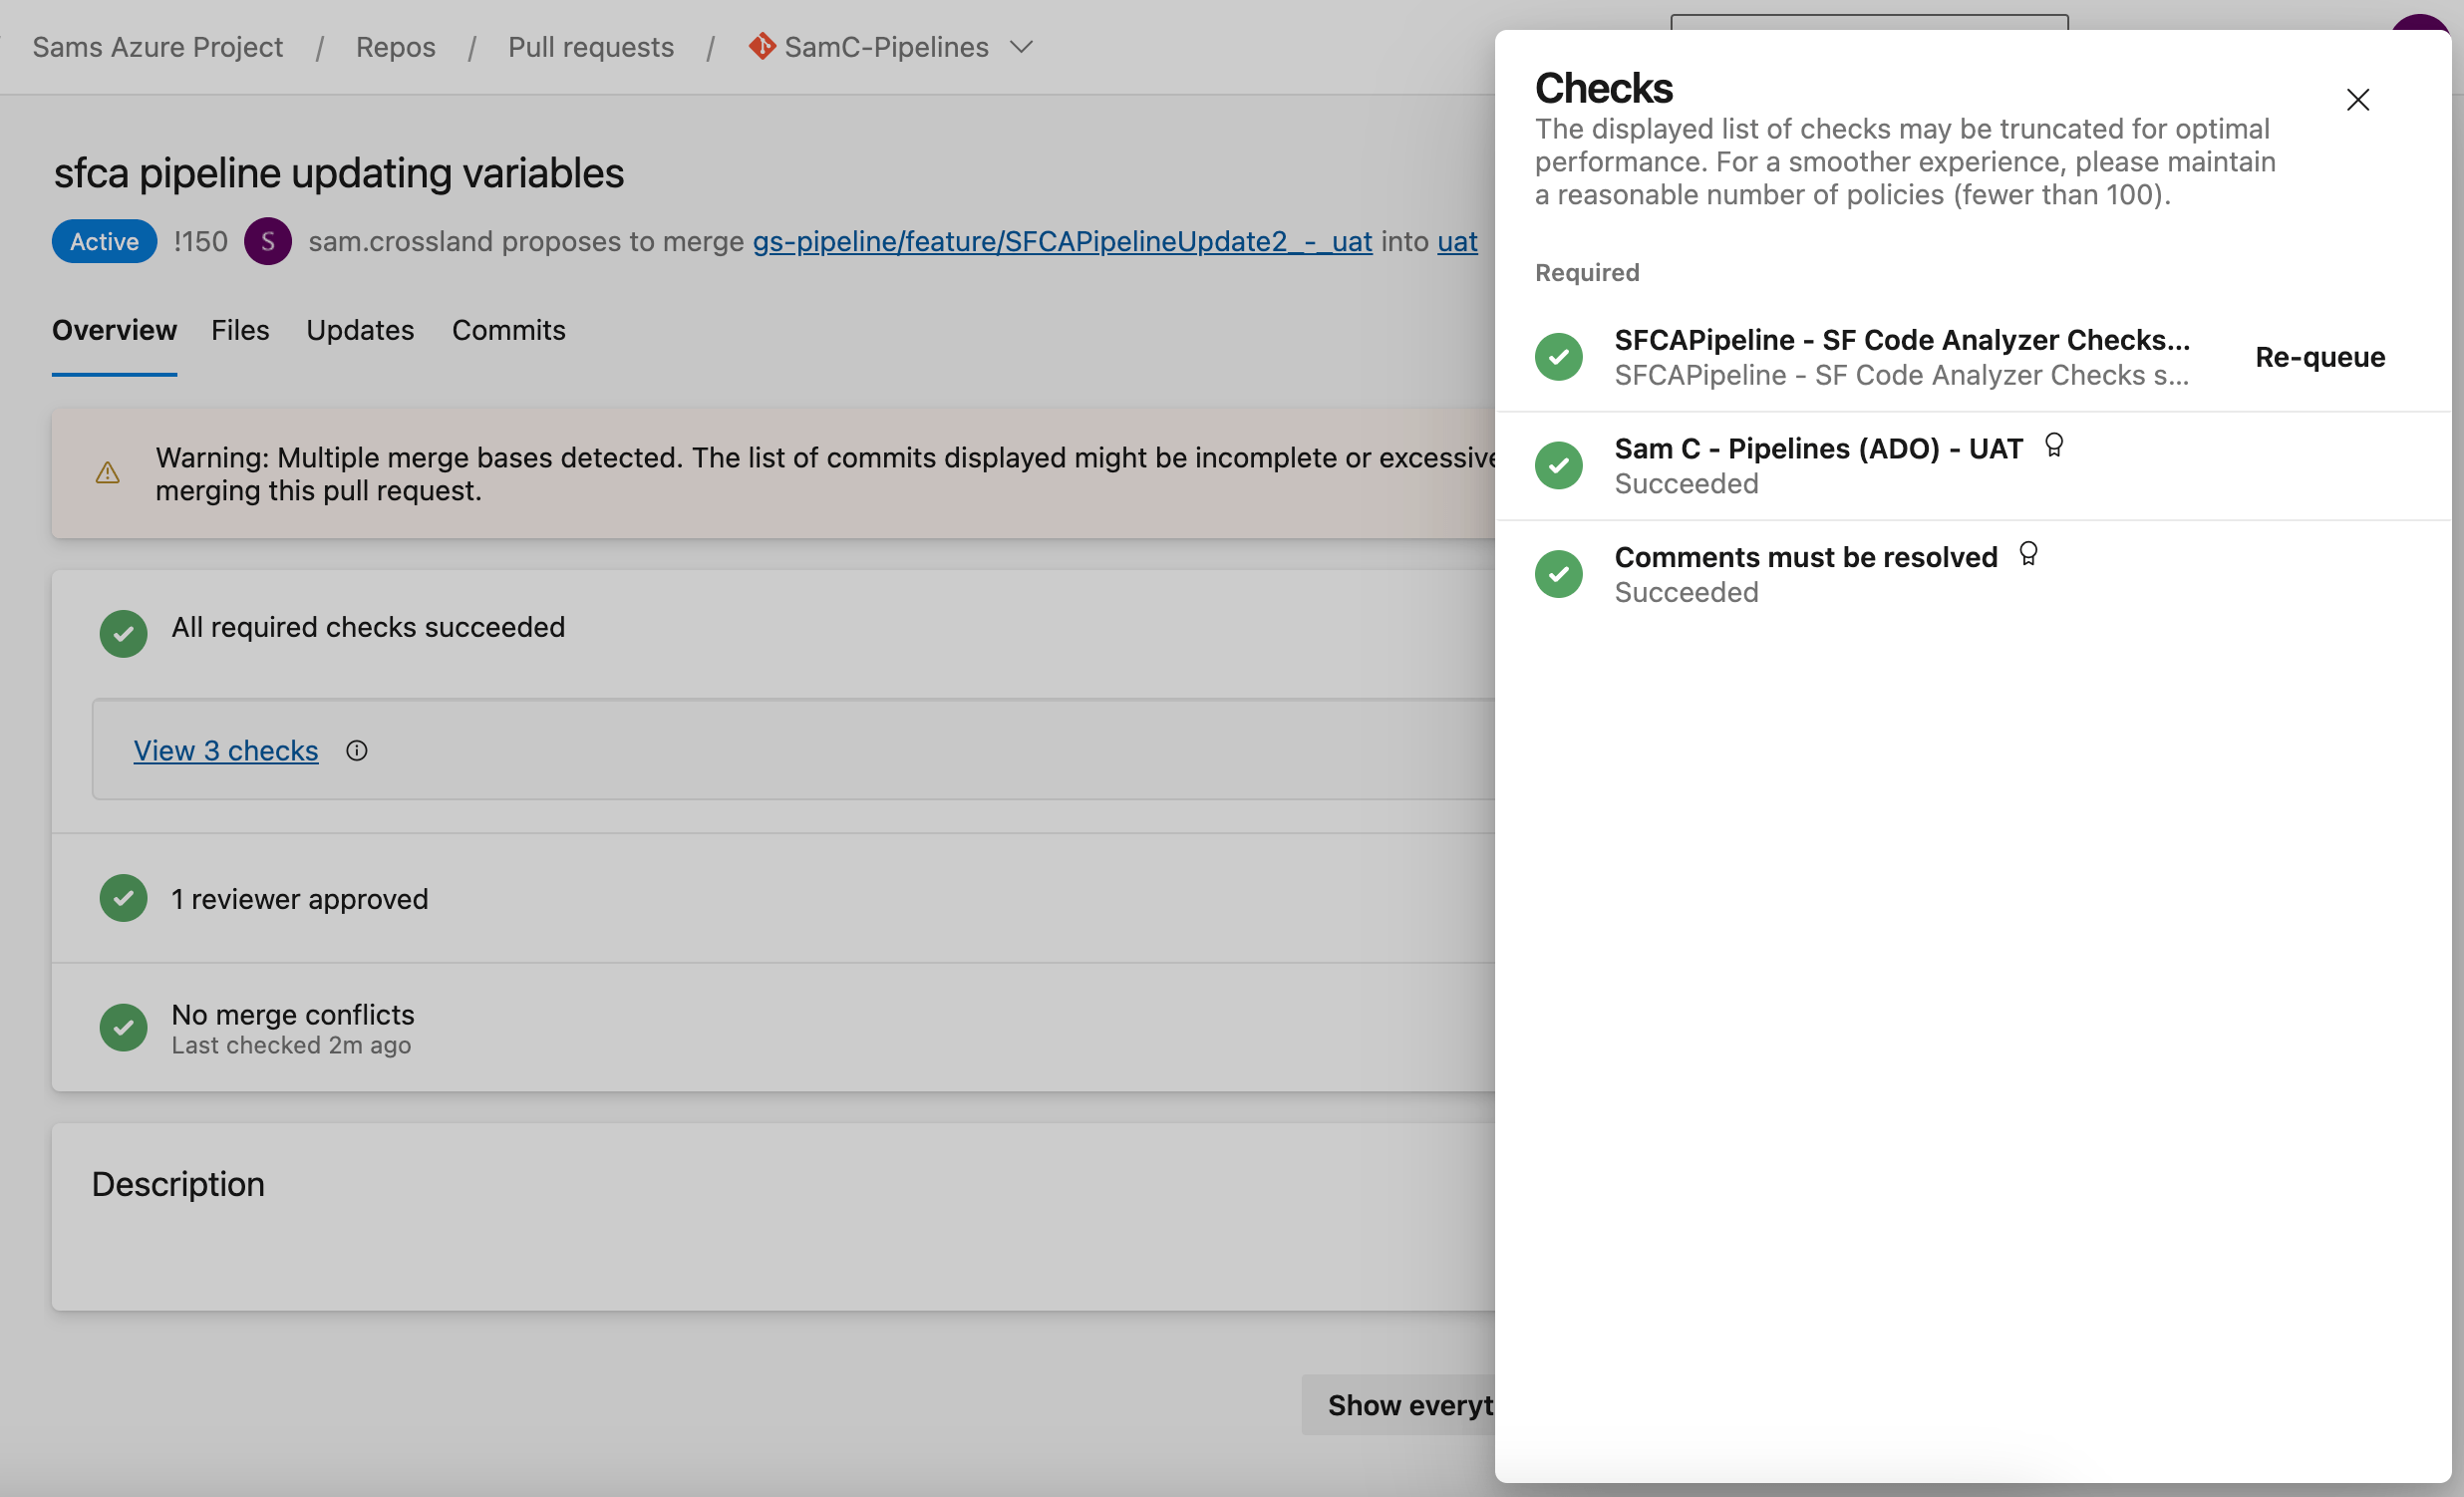
Once your ADO pipeline is configured, you’ll be able to see the status checks directly within the PR view in ADO by navigating to the Checks section. Here, you’ll see two types of checks related to the pipeline:
- Build Validation: the main pipeline trigger that remains visible throughout the PR lifecycle, playing a key role in determining if the PR can be merged.
- Code Analysis Completed: appears if valid file extensions (e.g. .cls, .js, .html) were scanned, and only after the pipeline completes and posts results back via the API.
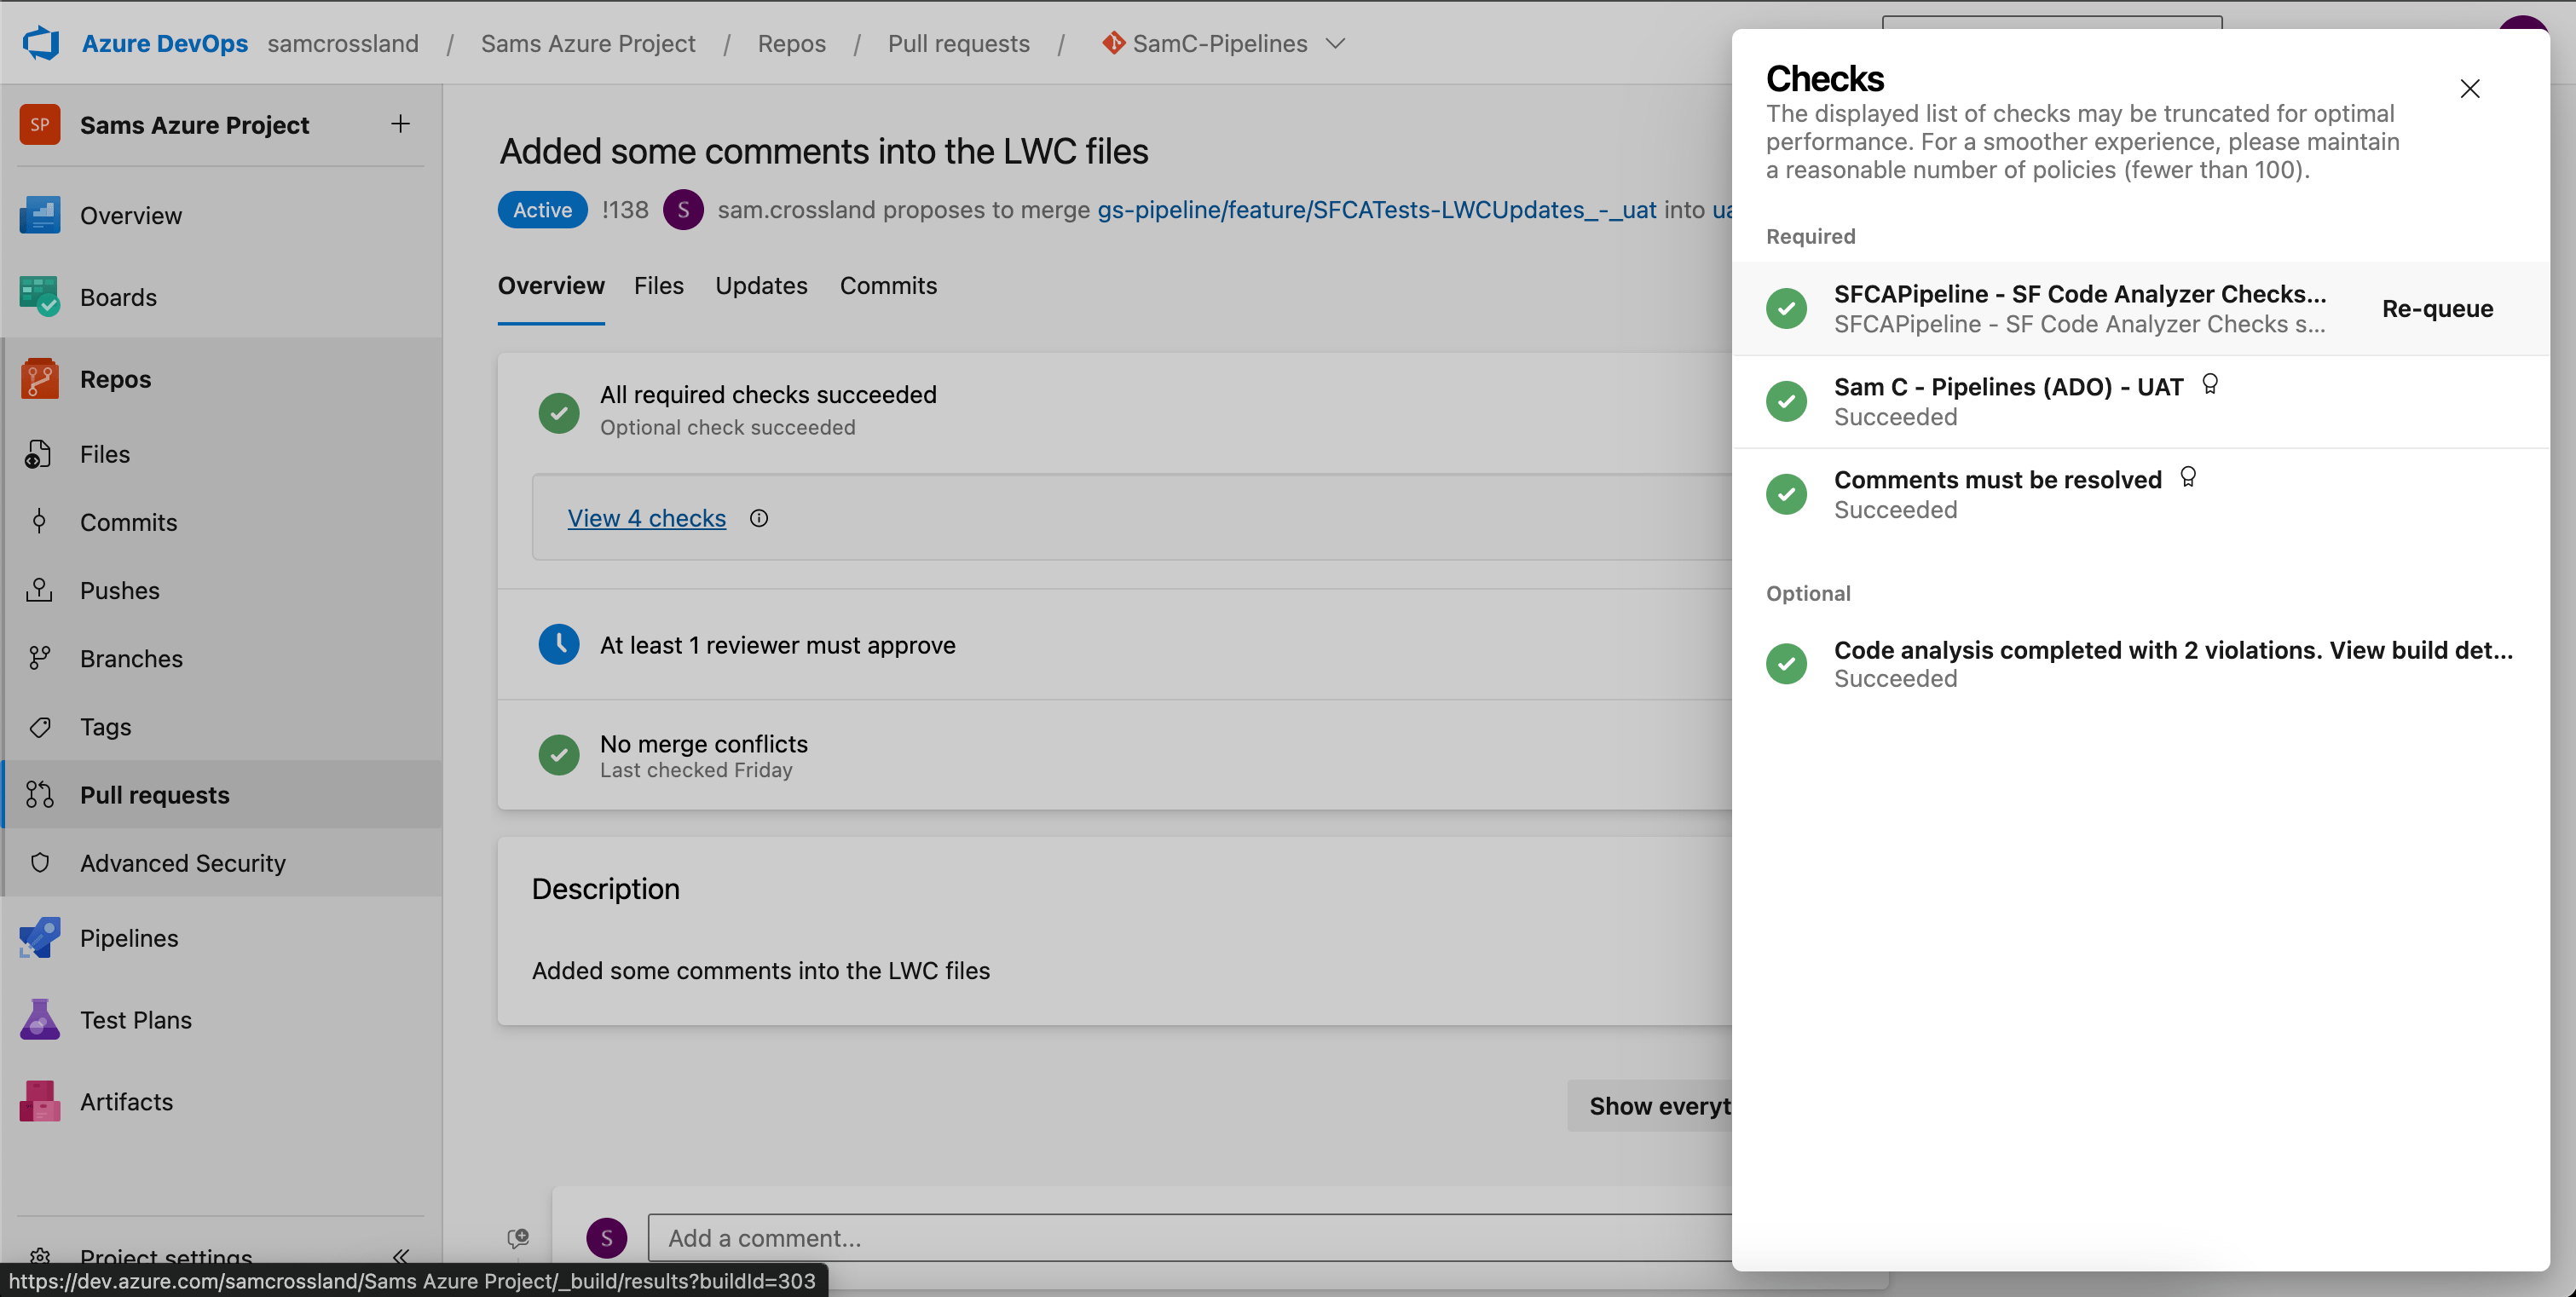
If you’re using Gearset, you can see extra information about the branch policies you have in place, like minimum reviewers or comment requirements. It will also split out the “Build Validation” rule from the extra PR status check (with a “Details” hyperlink to the side) separately, so you can click straight through to the build results if you configured that parameter.
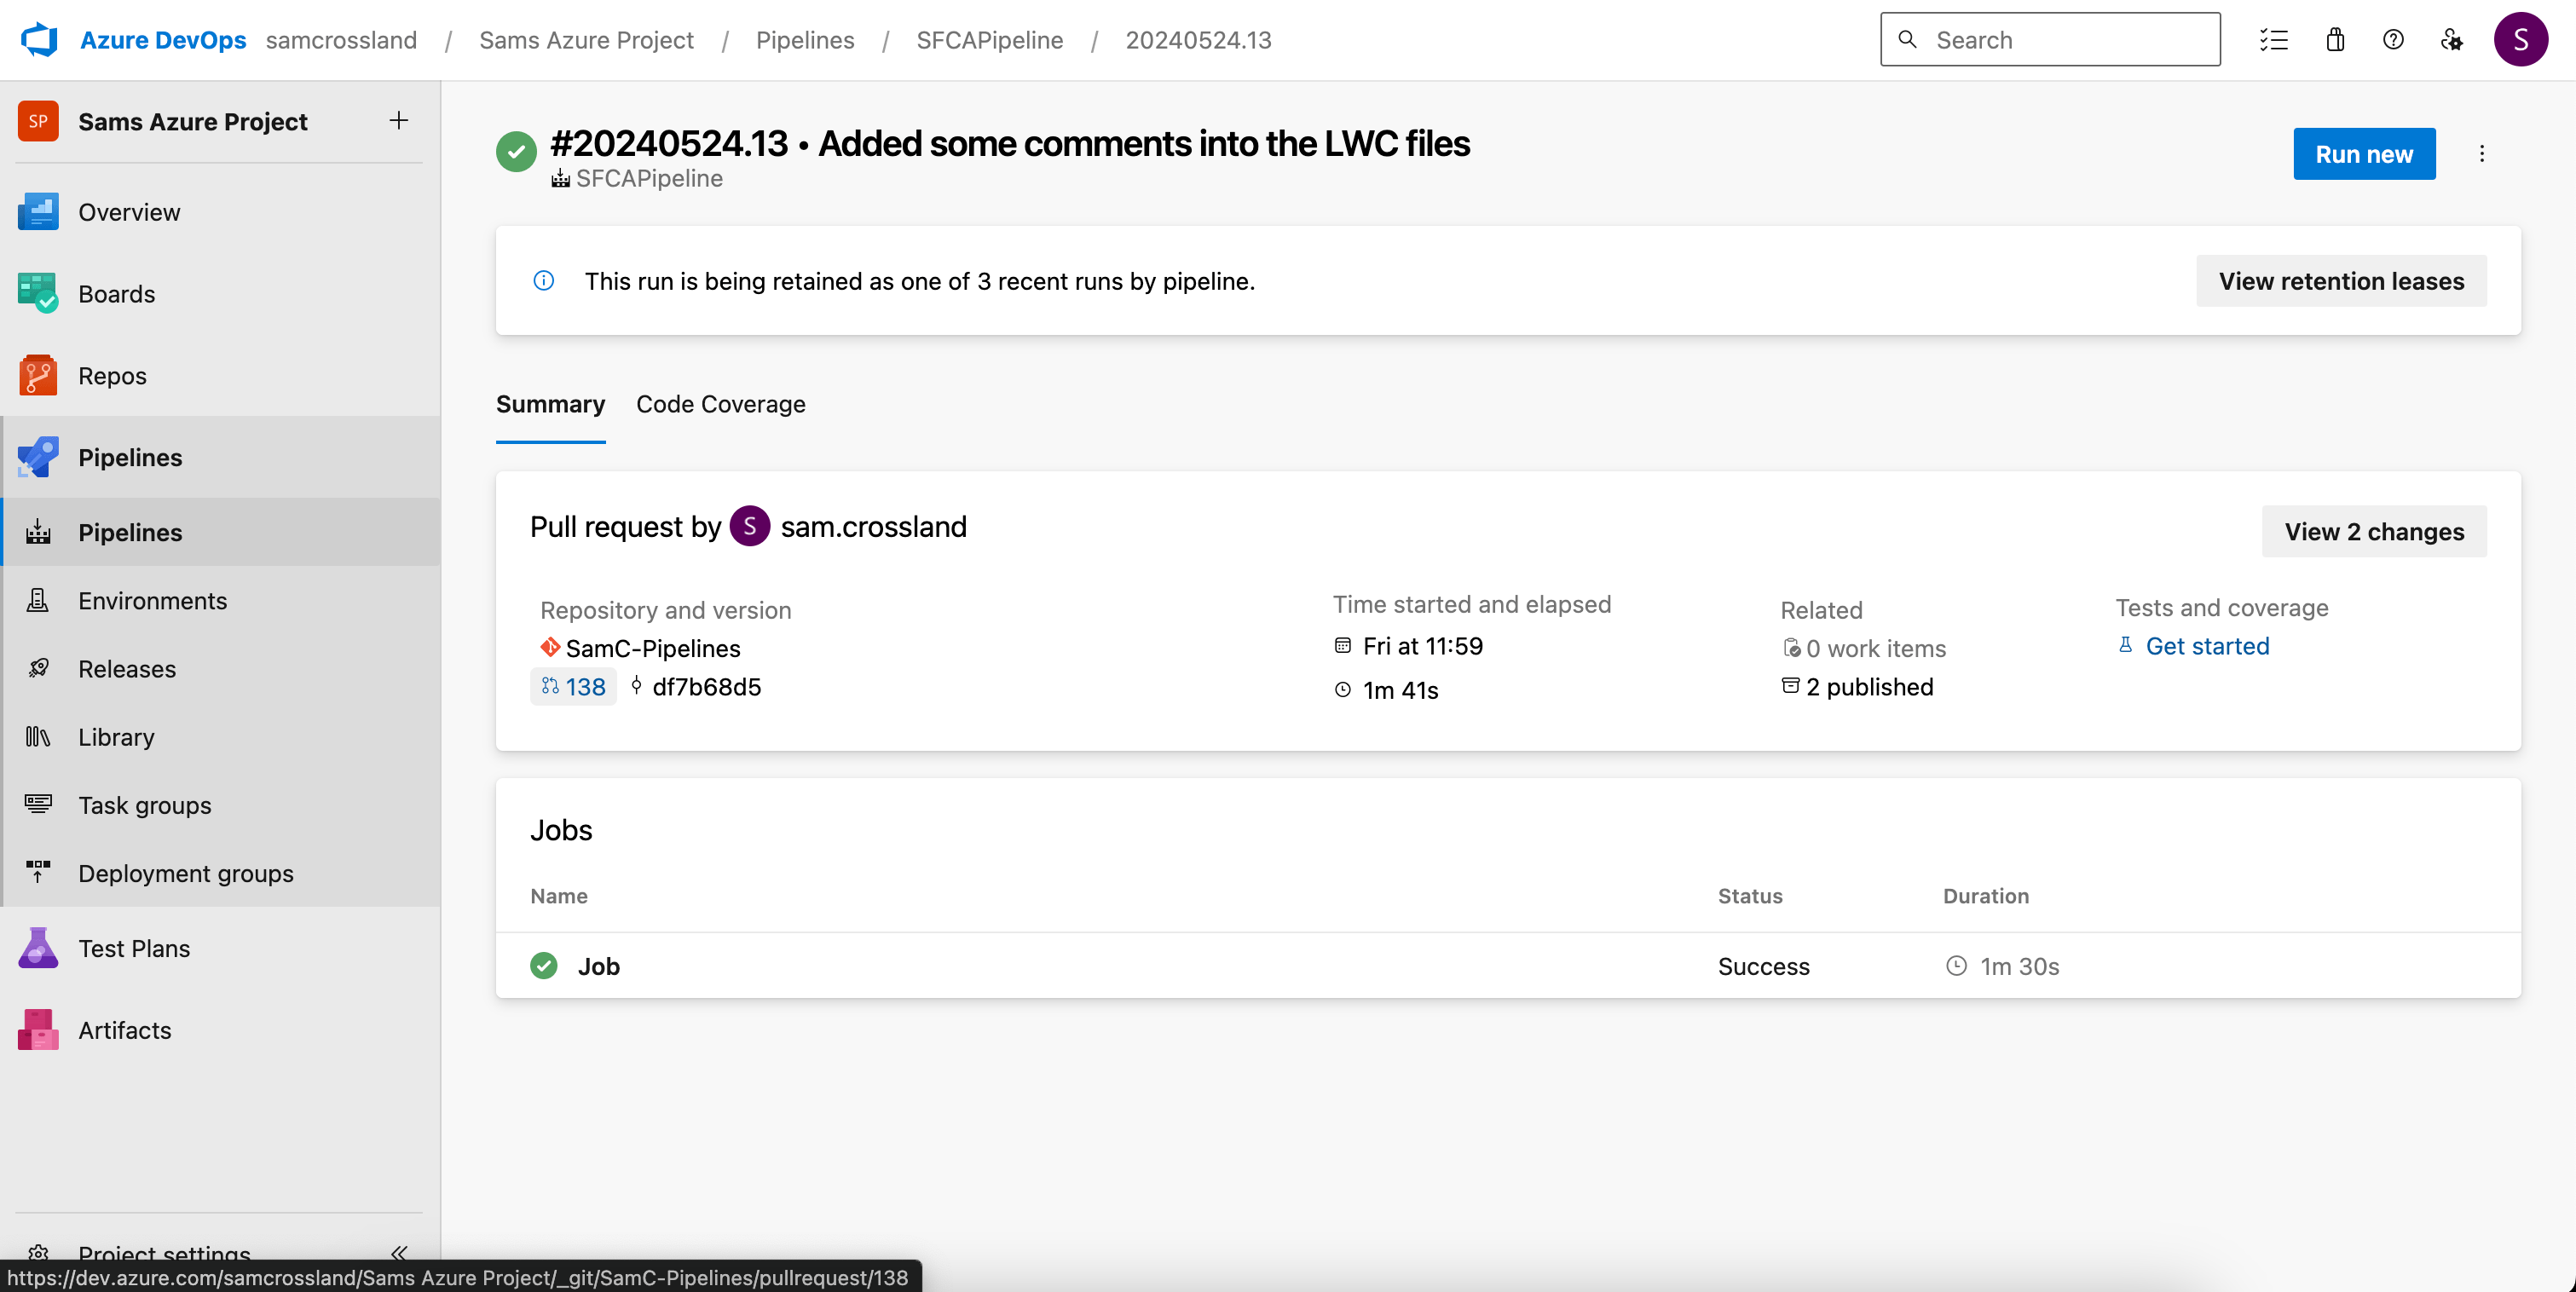
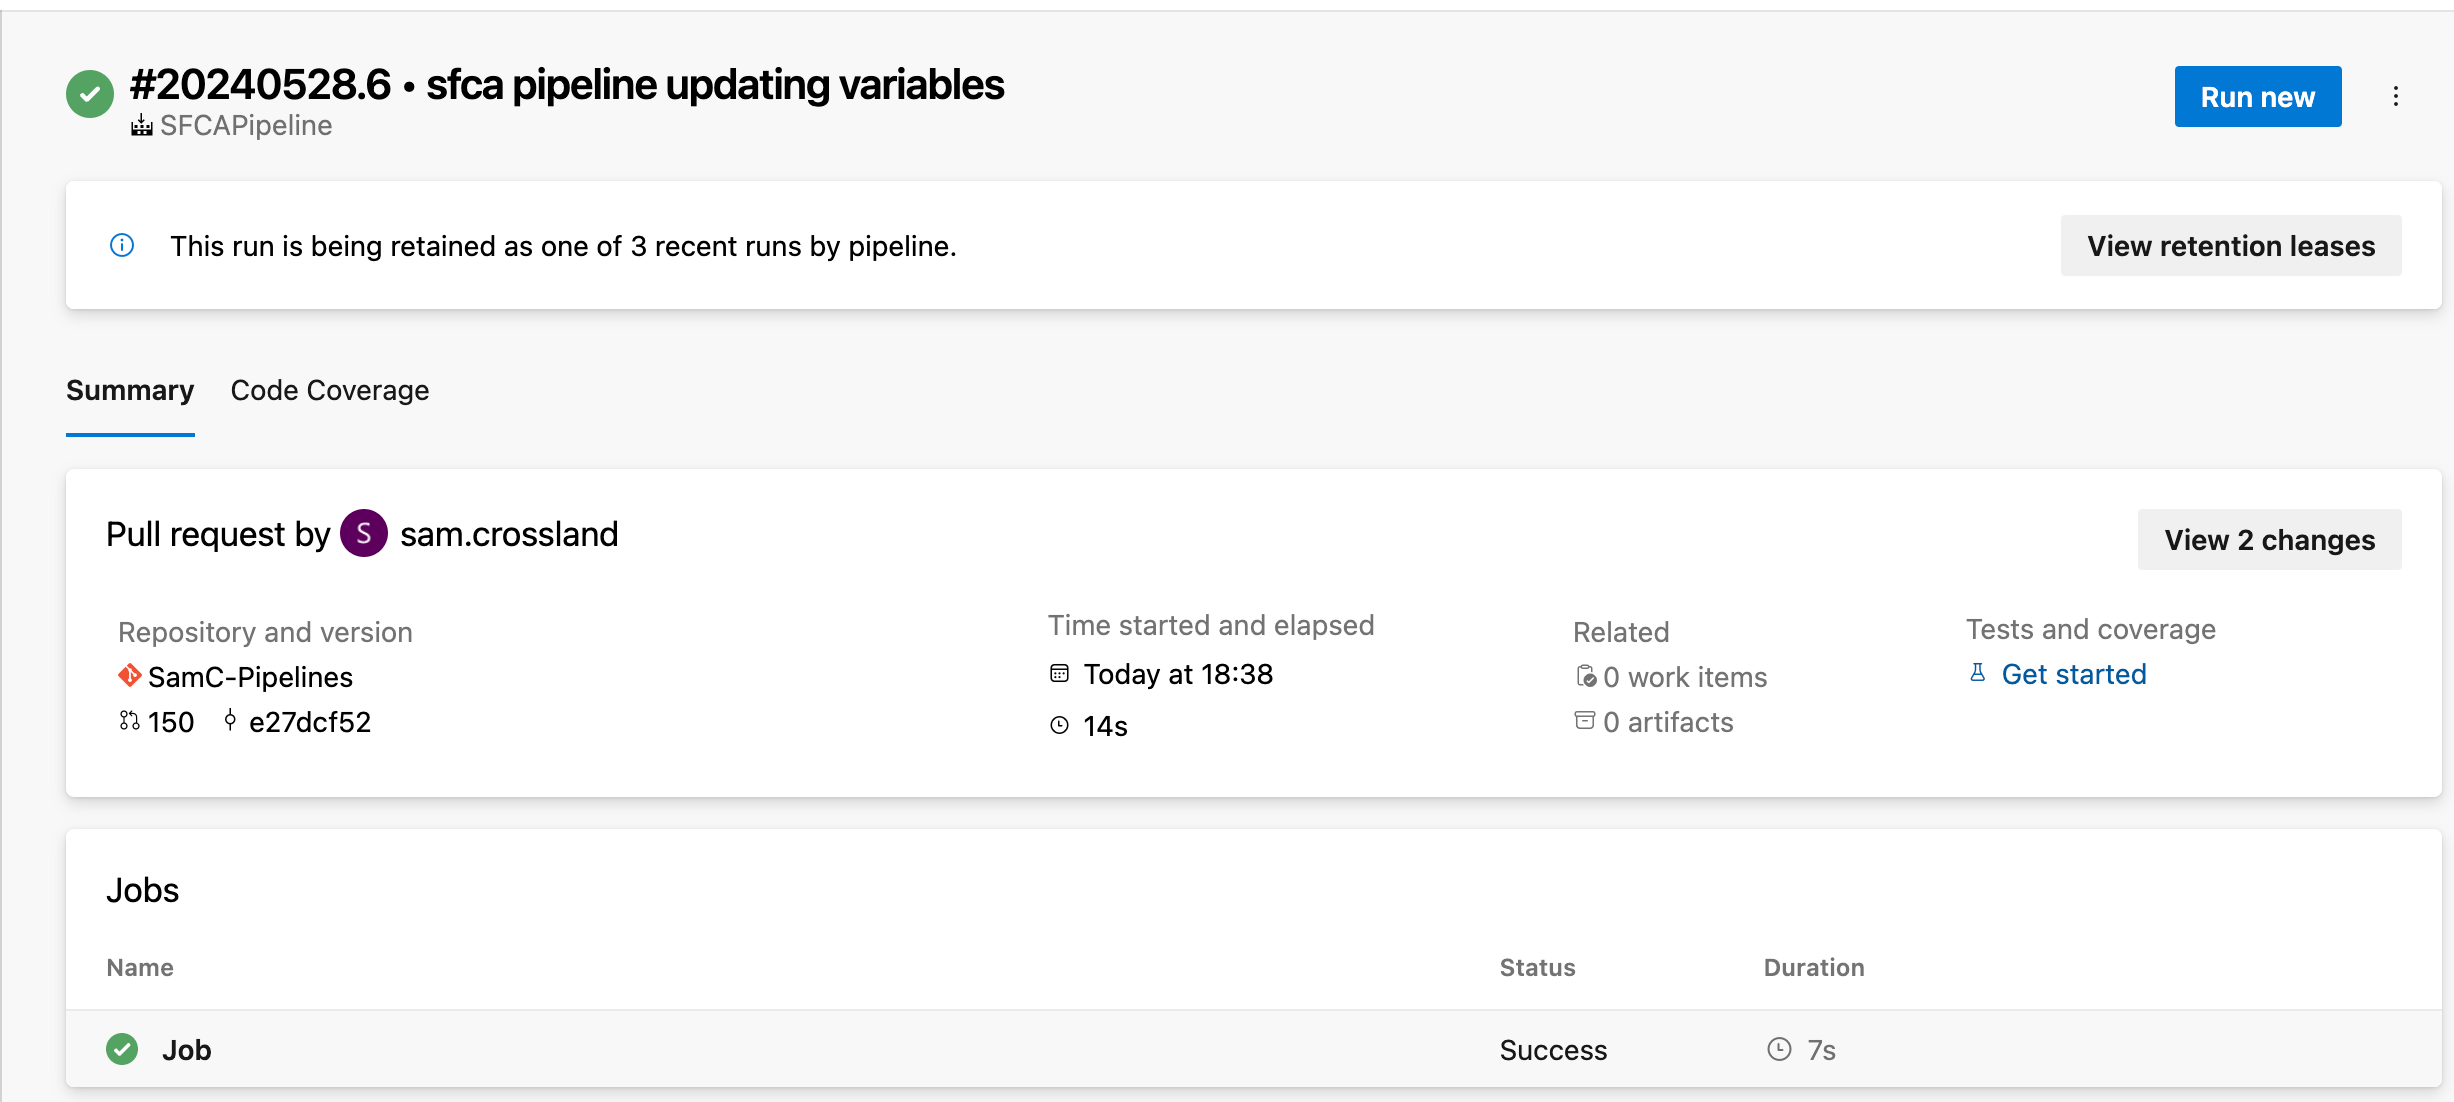
Exploring pipeline run details
Clicking on a status check takes you to the specific pipeline run in the Pipelines section of ADO. There, you’ll find metrics on build duration and completion time, details on the linked repository and associated PR, and any artifacts generated after the run — displayed as “2 published” in the Related section.
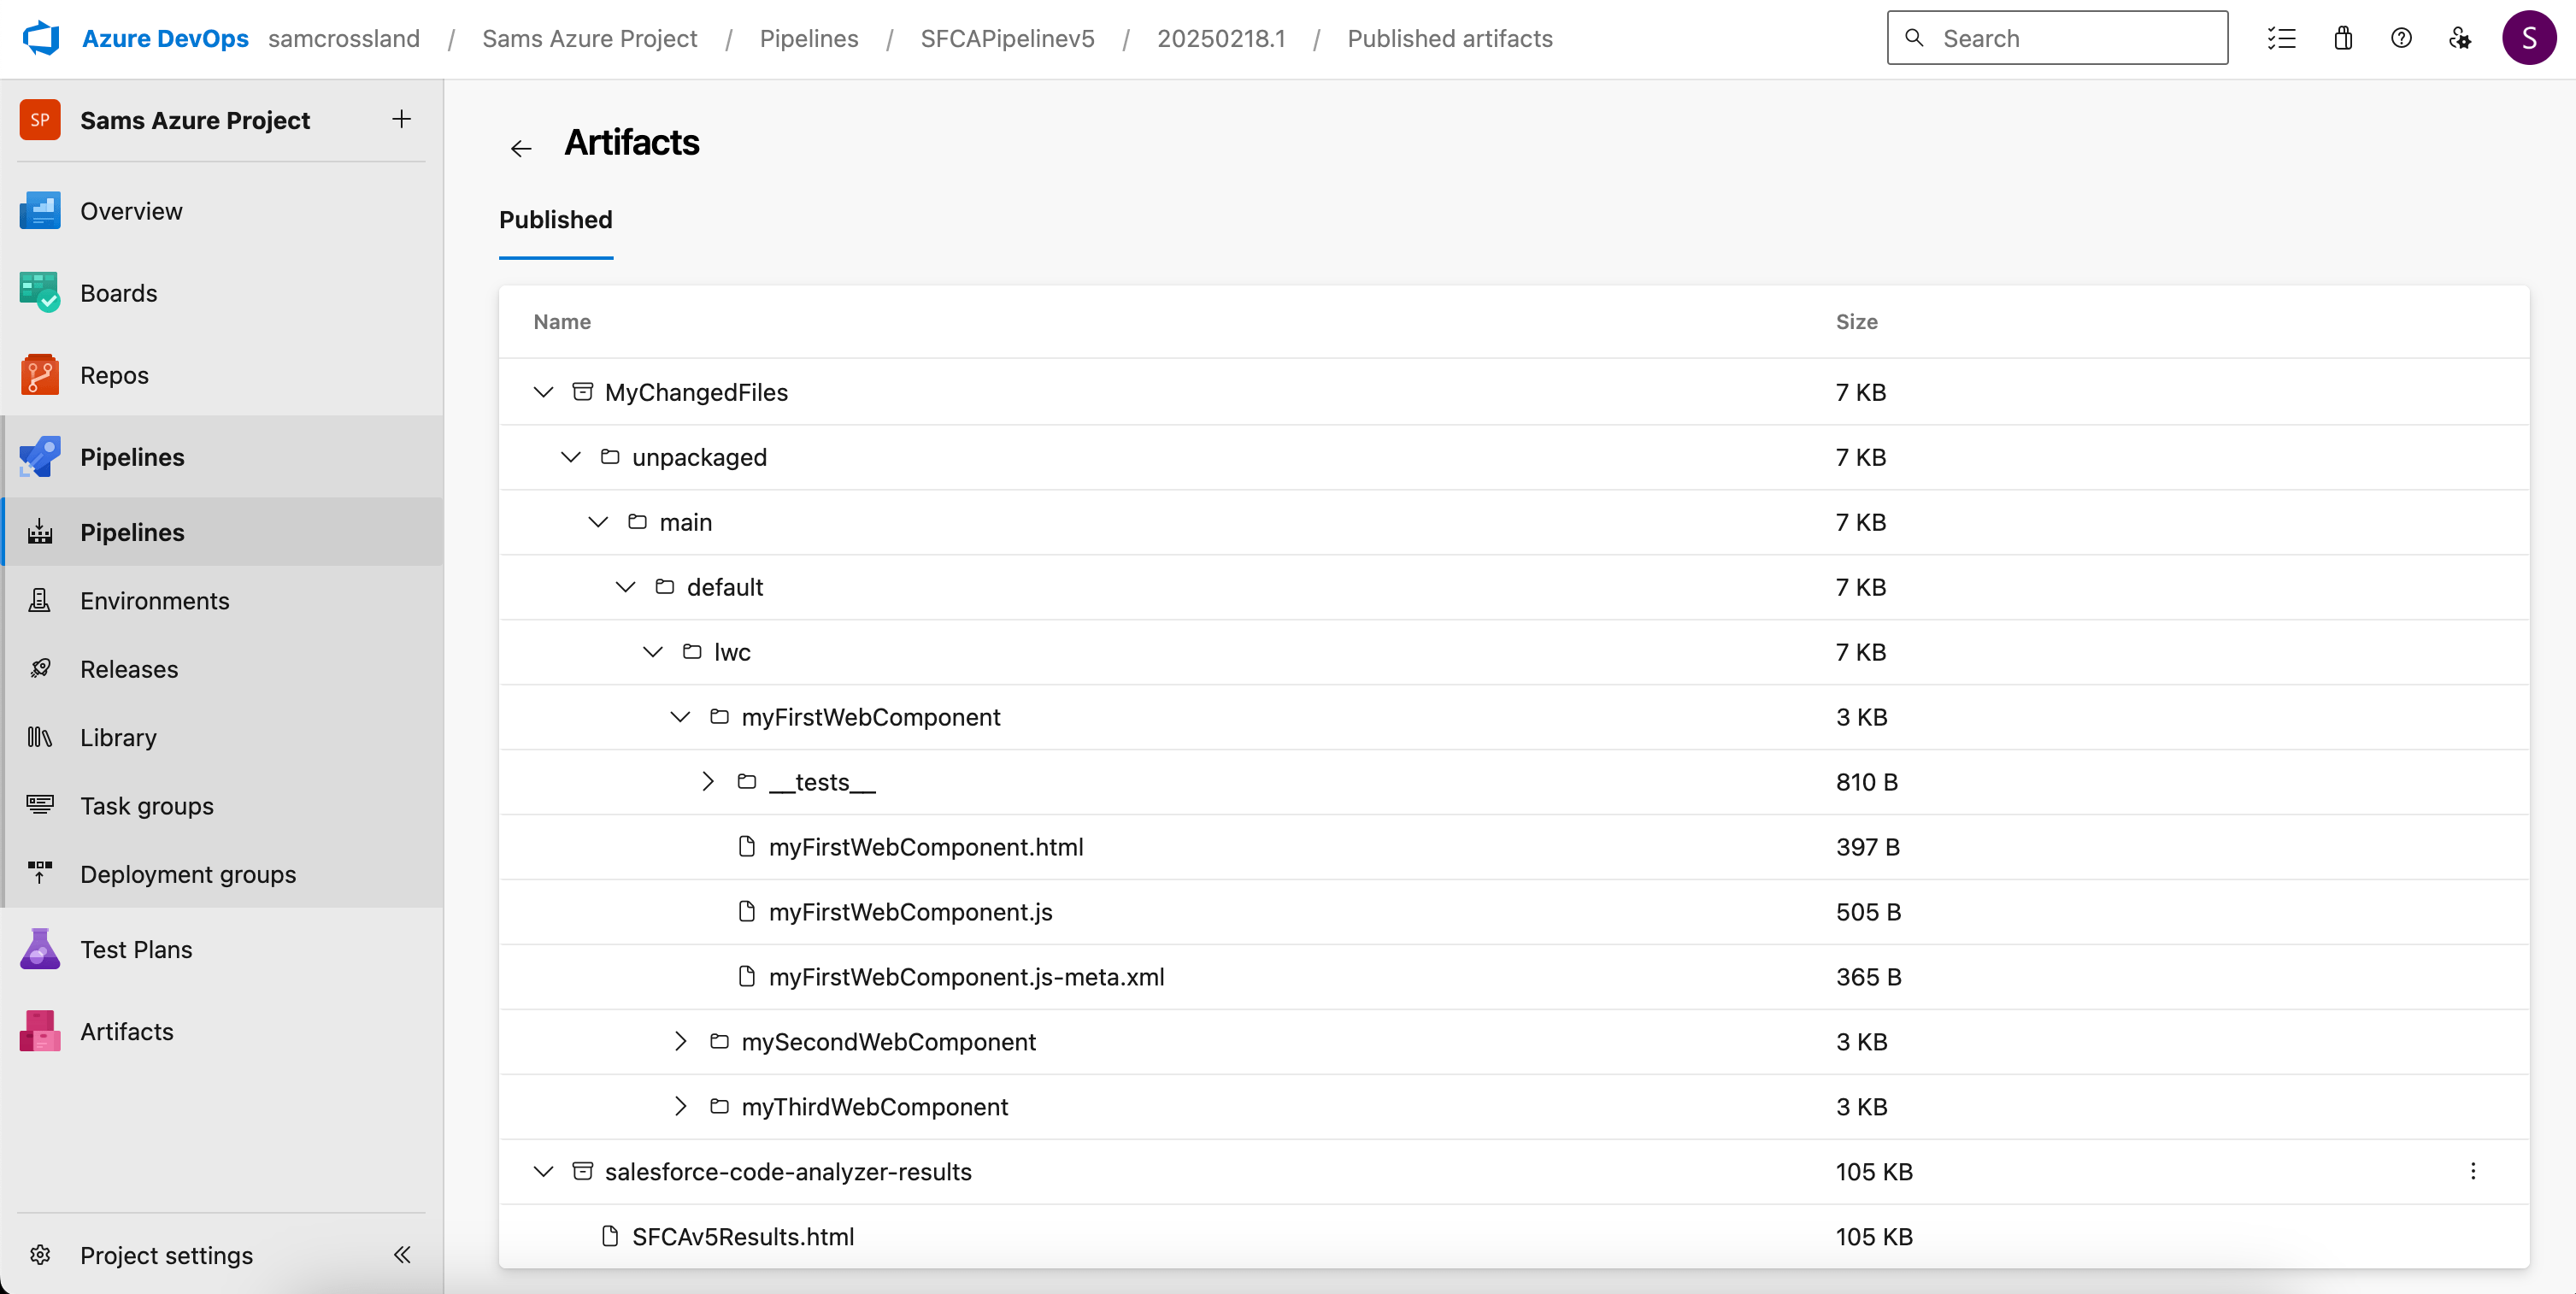
Accessing code analysis results
You can then click into Published Artifacts to see the folder/file breakdown of all files changed in the PR, as well as the code analyzer results file in html and json formats. This can be downloaded and viewed in your browser for filtering, investigation and further analysis.
What if no valid file types were found to scan?
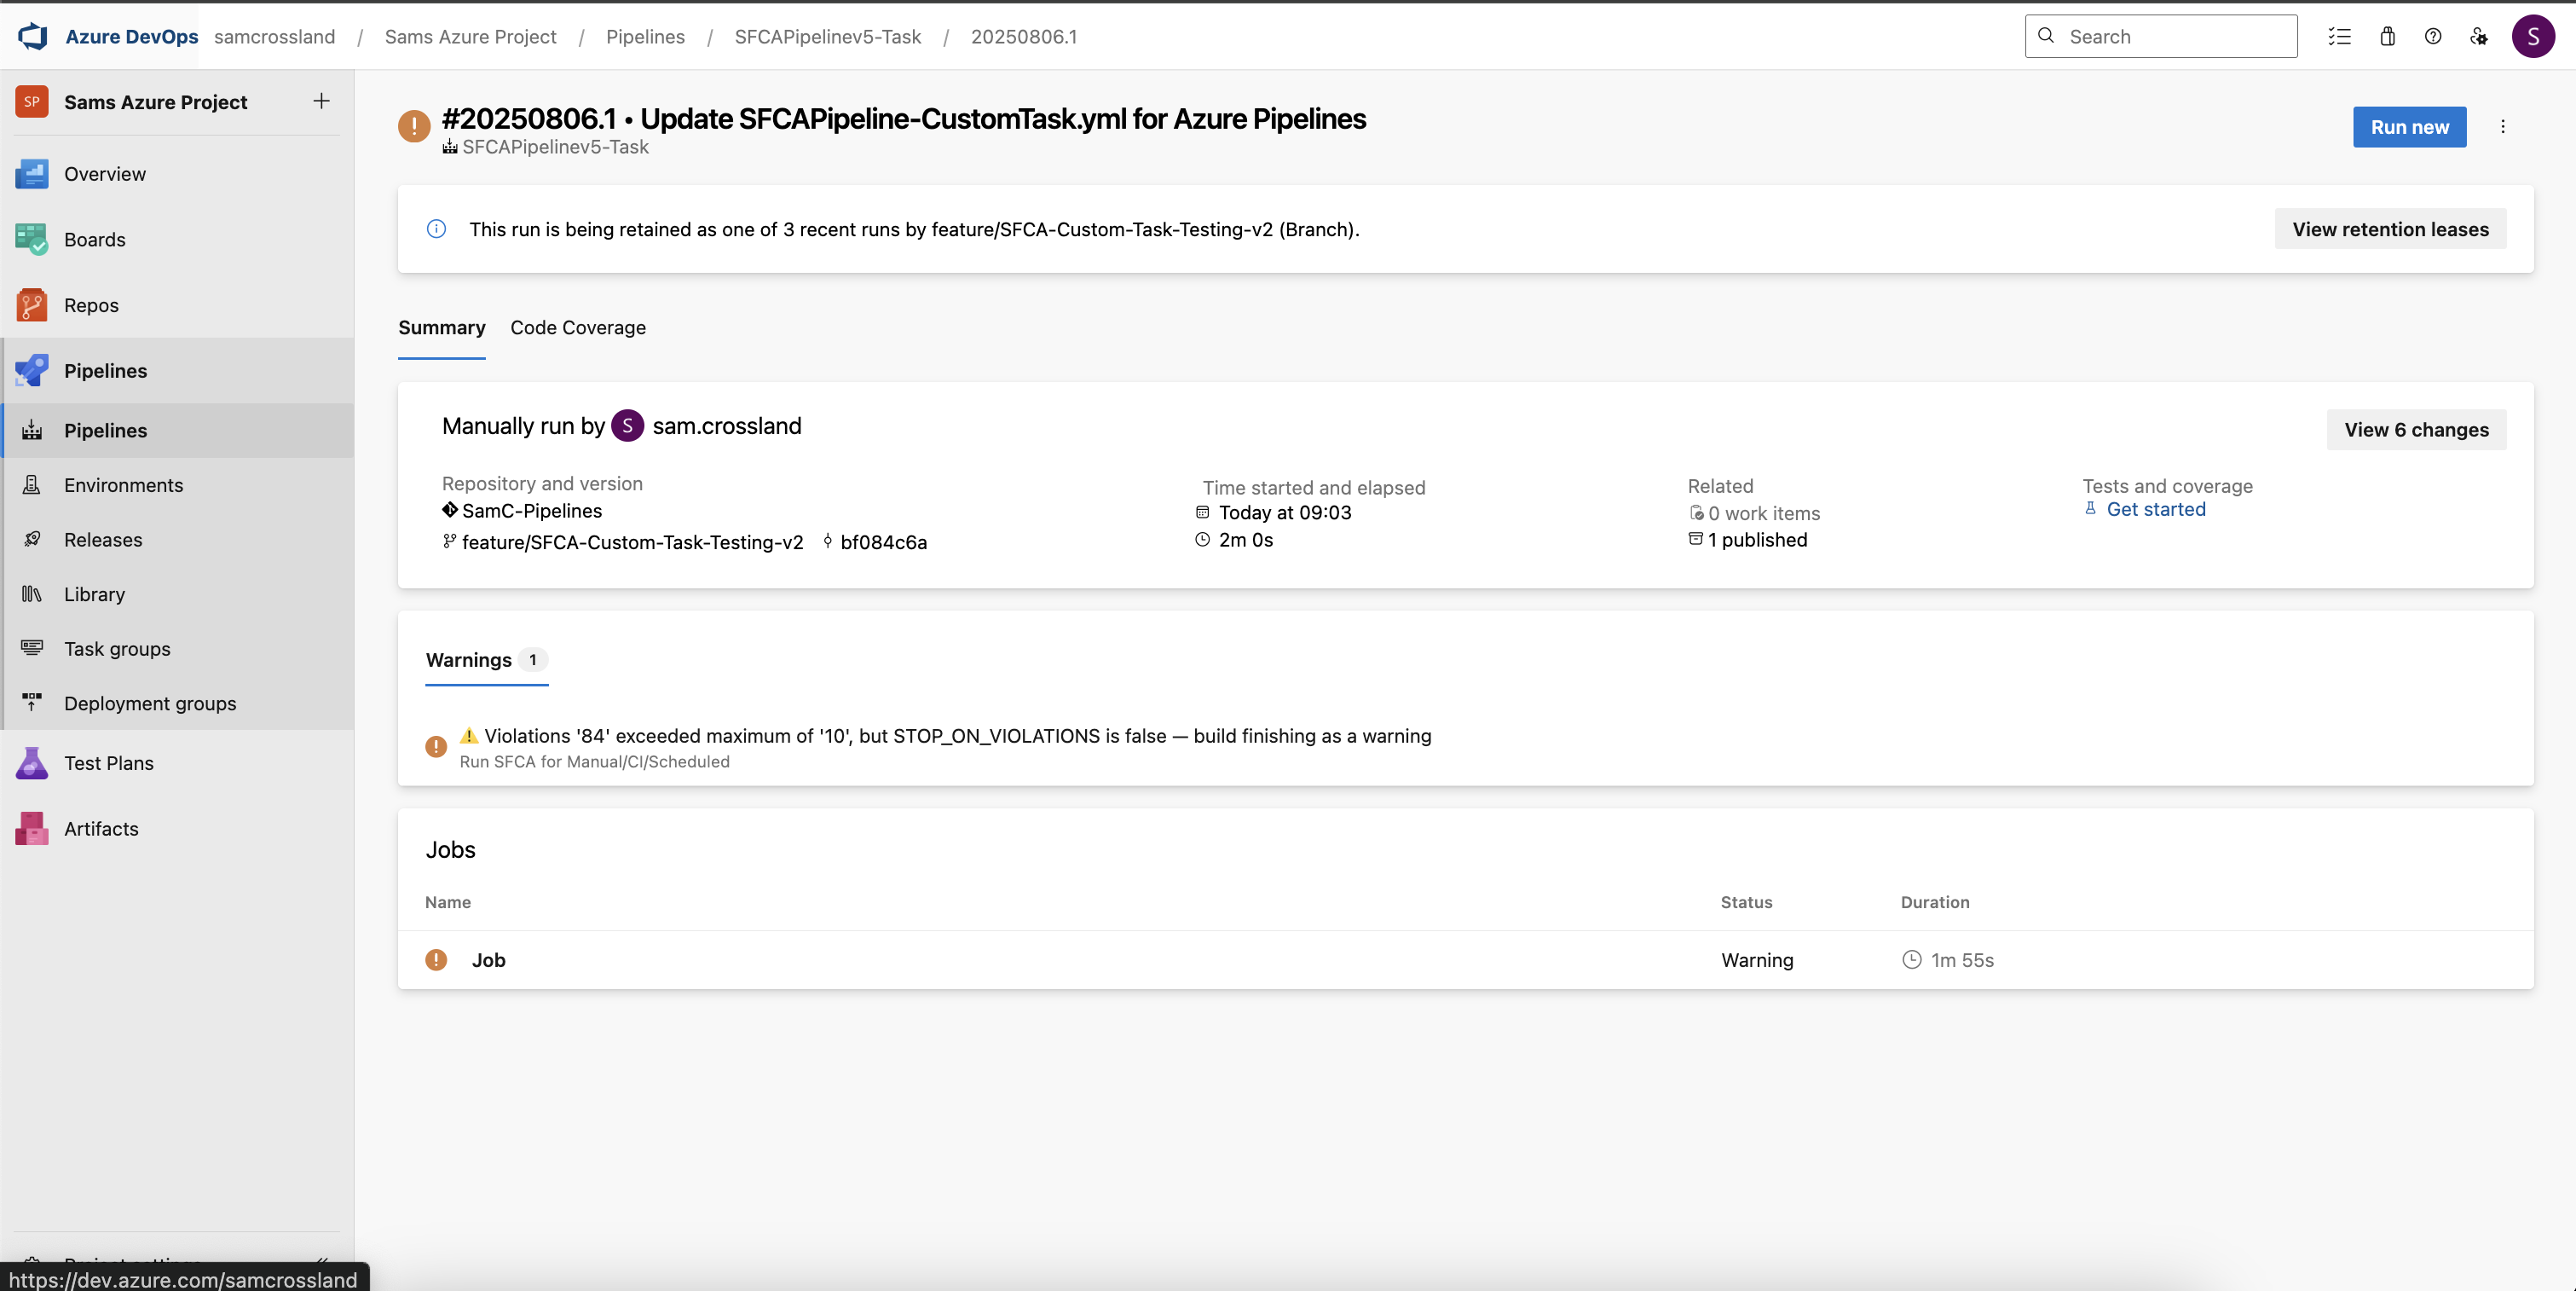
The ADO pipeline will run for every PR raised against your target branch. However, filtering logic built into the pipeline ensures that SFCA only runs if it detects relevant file types such as .cls, .js, or .html. If no valid files are found, the pipeline will still execute and produce a result in ADO, but no extra “Code Analysis” status check will appear on the PR.
If you look into that specific pipeline run, you'll see that no artifacts were generated, and the execution time taken will likely be just a few seconds rather than several minutes. This happens because the first part of the YAML file checks for relevant file extensions and then skips the remaining steps if no valid files are found.
Caveats and evolutions
Caveats
This guide uses an open source marketplace extension from the ADO library written by a community member. Please ensure you technically review the logic and leverage it at your own risk, as per the relevant licence, and direct bugs/issues into the GitHub repository.
Be sure to consider the relevant parameters you’re passing to the custom task, and determining whether you’d like to leverage one yml file to control both branch and PR scans, or split them up to separate responsibilities.
Evolutions
Since you can now leverage the configuration file “code-analyzer.yml” as part of the extension, which allows a ton of customization across the different engines, severities and custom rules, extending that to include further configurations like a custom PMD/ESlint ruleset would be useful for teams wanting even more flexibility.
To reduce pipeline execution times, you could pre-create a virtual machine (VM) with essential tools like Node.js, the Salesforce CLI, and SFCA already installed. This could speed up the setup process during runs. However, managing and keeping the pre-built VM up to date introduces additional maintenance overhead, which is beyond the scope of this guide and could cause issues with some of the extension’s install steps.
Other ideas are welcome on the issues page here!
Considerations
We’ve seen how SFCA can be integrated into your CI/CD processes inside ADO, but what are some of the key considerations when it comes to using SFCA in comparison to some others in the marketplace?
Managing delta file scans
One of SFCA’s current limitations is the lack of native support for scanning only the delta files in a pull request (PR). While you can specify target files to scan through CLI arguments, determining which files to include requires additional logic — like the filtering steps outlined earlier. This can be challenging when your priority is identifying newly introduced issues rather than addressing existing technical debt across the codebase. Some commercial code review solutions handle this delta scanning challenge out of the box, distinguishing new violations from legacy issues without custom scripting.
Strategically placing SFCA in your development workflow
Adopting a “shift left” approach — integrating security and quality checks earlier in the development cycle — is highly recommended. But, timing and placement of SFCA scans are crucial to maximizing their value without disrupting workflows.
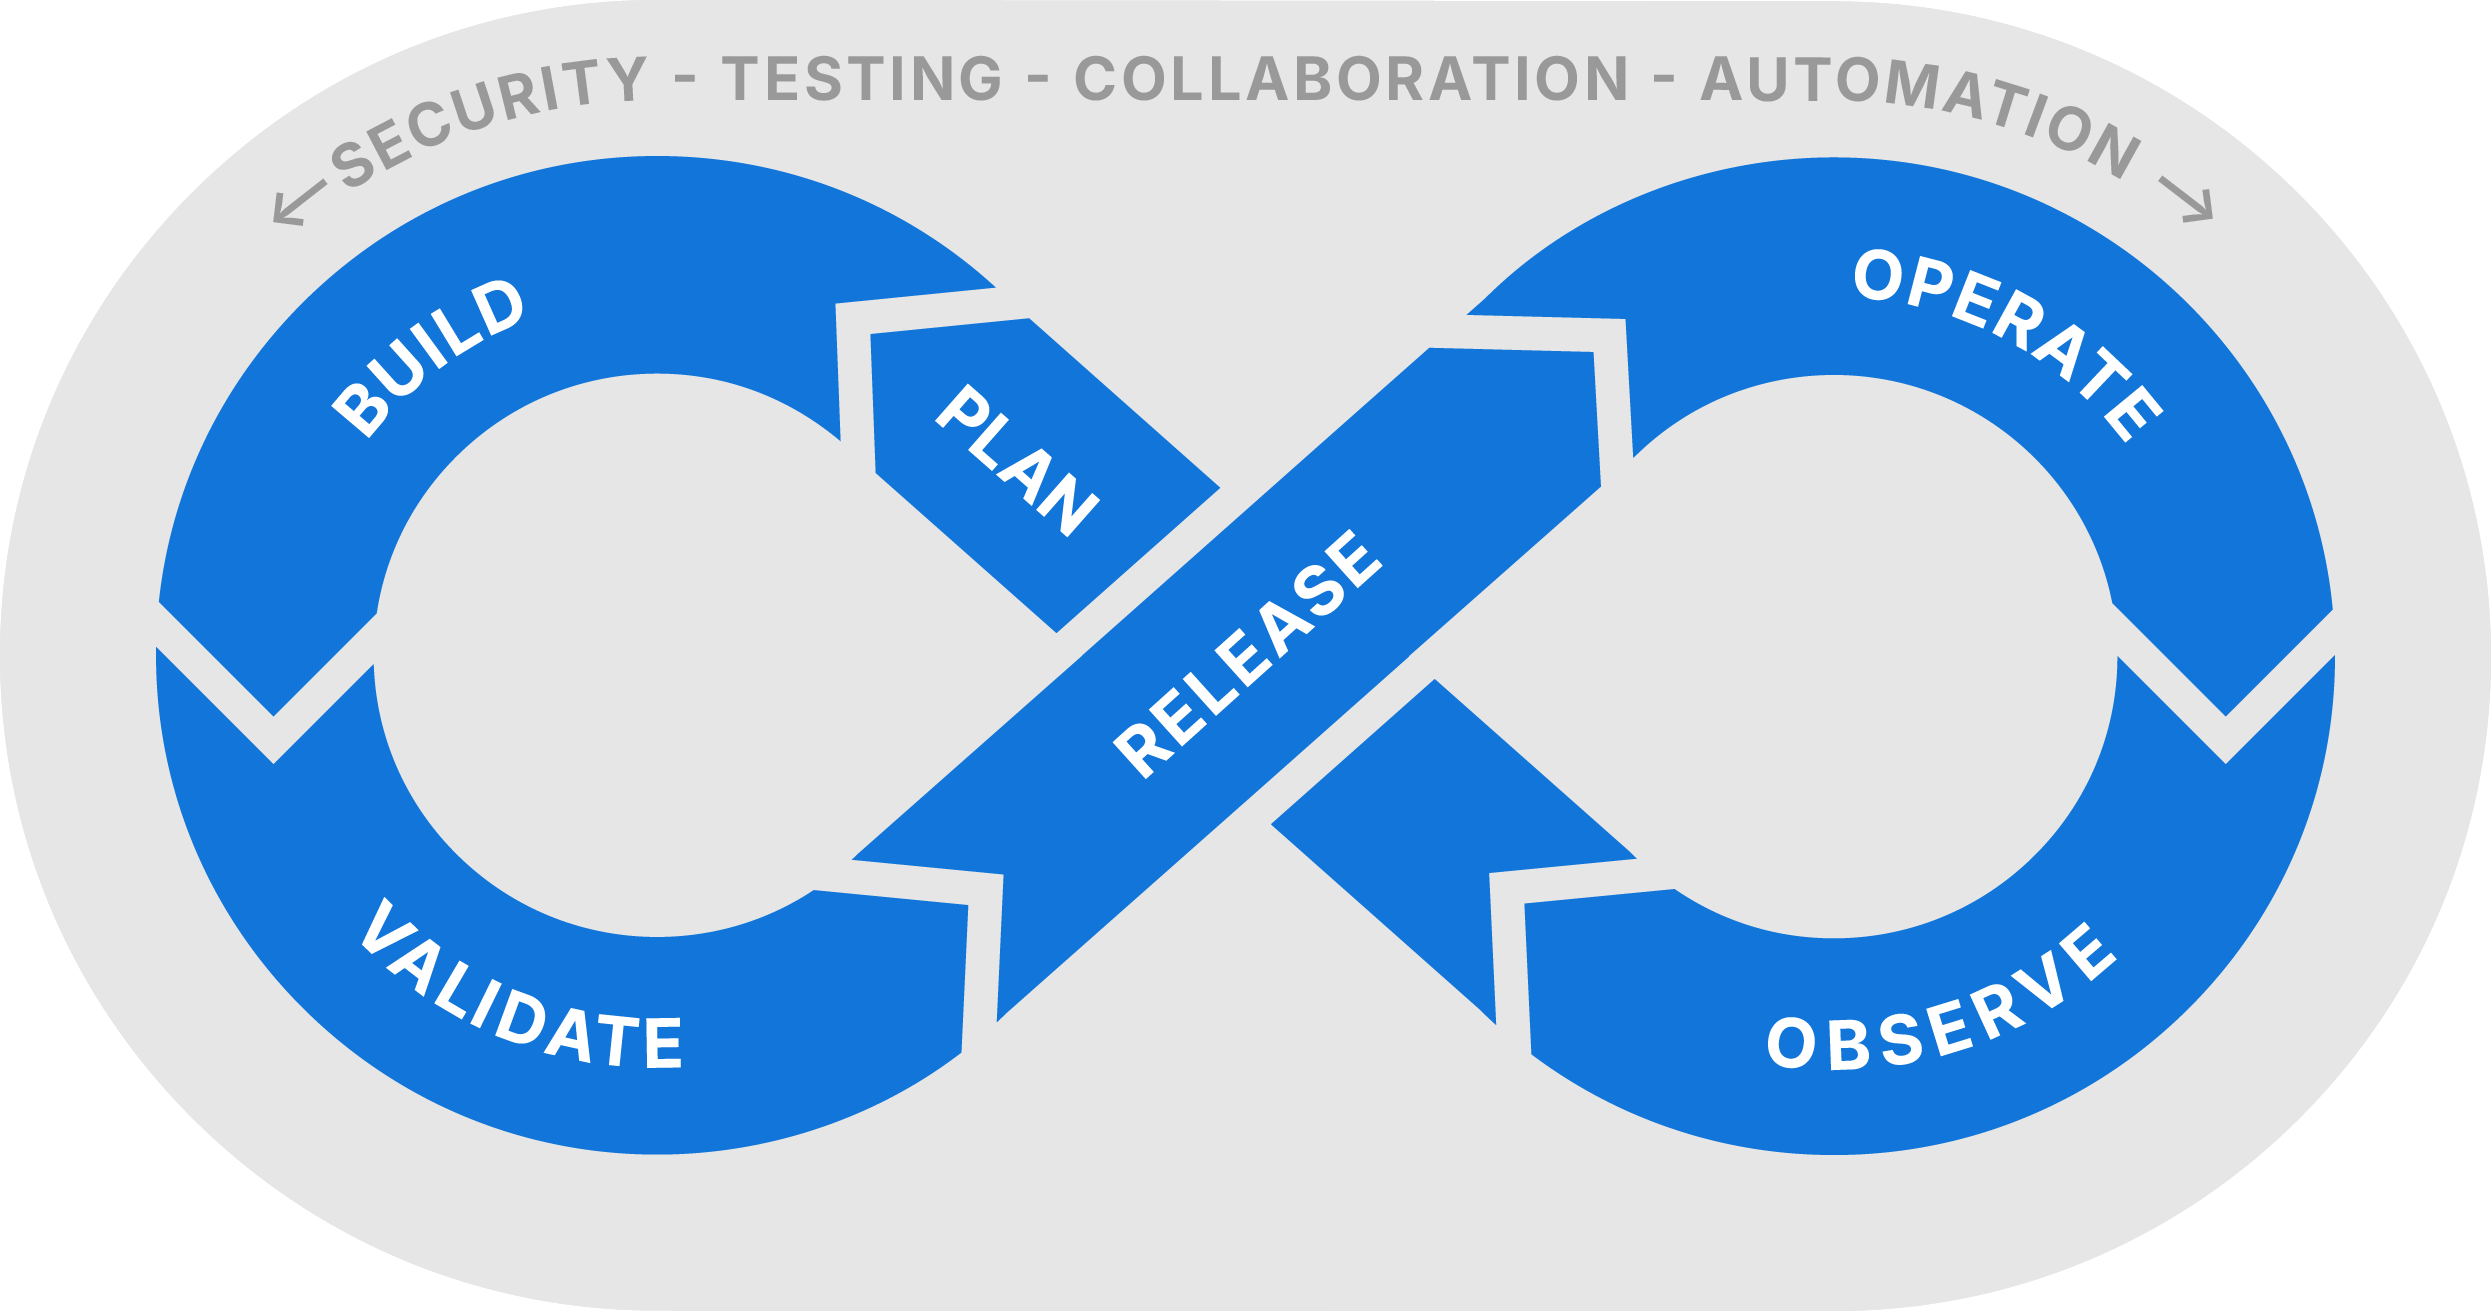
Running scans locally in developers’ IDEs can be highly effective for catching issues early during development (the “Build” phase). But, local scans may lack centralized reporting, making it harder to track issues across teams. Incorporating multiple quality gates is a best practice:
- PR-based scans (as covered in this guide) help prevent issues from reaching shared branches during testing (the “Validate” stage)
- One-off or scheduled scans across entire codebases can catch broader issues and support periodic code health assessments (the “Observe” stage)
Selecting the appropriate engines for each scan type — based on resource usage and scan focus — ensures you strike the right balance between thoroughness and efficiency.
Interpreting and acting on scan results
Collecting scan results is only the first step — knowing what to do with the data is equally important. You should consider:
- Who is responsible for reviewing and analyzing scan outputs?
- Who should be notified of identified issues?
- Should the issues be incorporated into existing user stories or handled as separate tasks?
With SFCA, each run produces individual reports that require manual storage, interpretation, and tracking. Over time, this manual process can become burdensome, especially for teams managing multiple scans across large codebases.
Planning for ongoing maintenance and upgrades
SFCA, like any evolving tool, requires regular maintenance to stay up to date with new versions and features. For instance, the release of v5 introduced the Flowtest engine, which added Python as a prerequisite. It’s likely that future versions will include additional dependencies. Teams should plan for:
- Version upgrades and compatibility checks
- Regression testing to ensure new features don’t disrupt existing pipelines
- Monitoring release notes for new pre-requisites or changes to scanning capabilities
Proactively managing these updates helps prevent unexpected disruptions in your development process.
What next?
Now that you’ve seen how to set up SFCA in Azure DevOps — along with the prerequisites, quirks, and key considerations — the next step is to try it out for yourself! Hands-on experimentation is the best way to understand how SFCA fits into your development workflow.
Key resources to help you get started
- This blog — treat it as your setup guide.
- The marketplace extension here, and associated repository here — where you can see the code and raise any issues/enhancement requests.
- Salesforce Code Analyzer extension v5 documentation, and CLI commands.
As an open-source community project, your feedback is invaluable. If you have suggestions, improvements, or tweaks to enhance the configuration, I’d love to hear from you at [email protected]. To learn even more about Static Code Analysis for Salesforce, you may also find the DevOps Launchpad Static Code Analysis and PMD course useful. Good luck!